Total Articles 196+

All Posts

Explore the latest sustainability news, innovations, insights, and industry stories from around the world.

Showing 12/196

04 Sep 2026

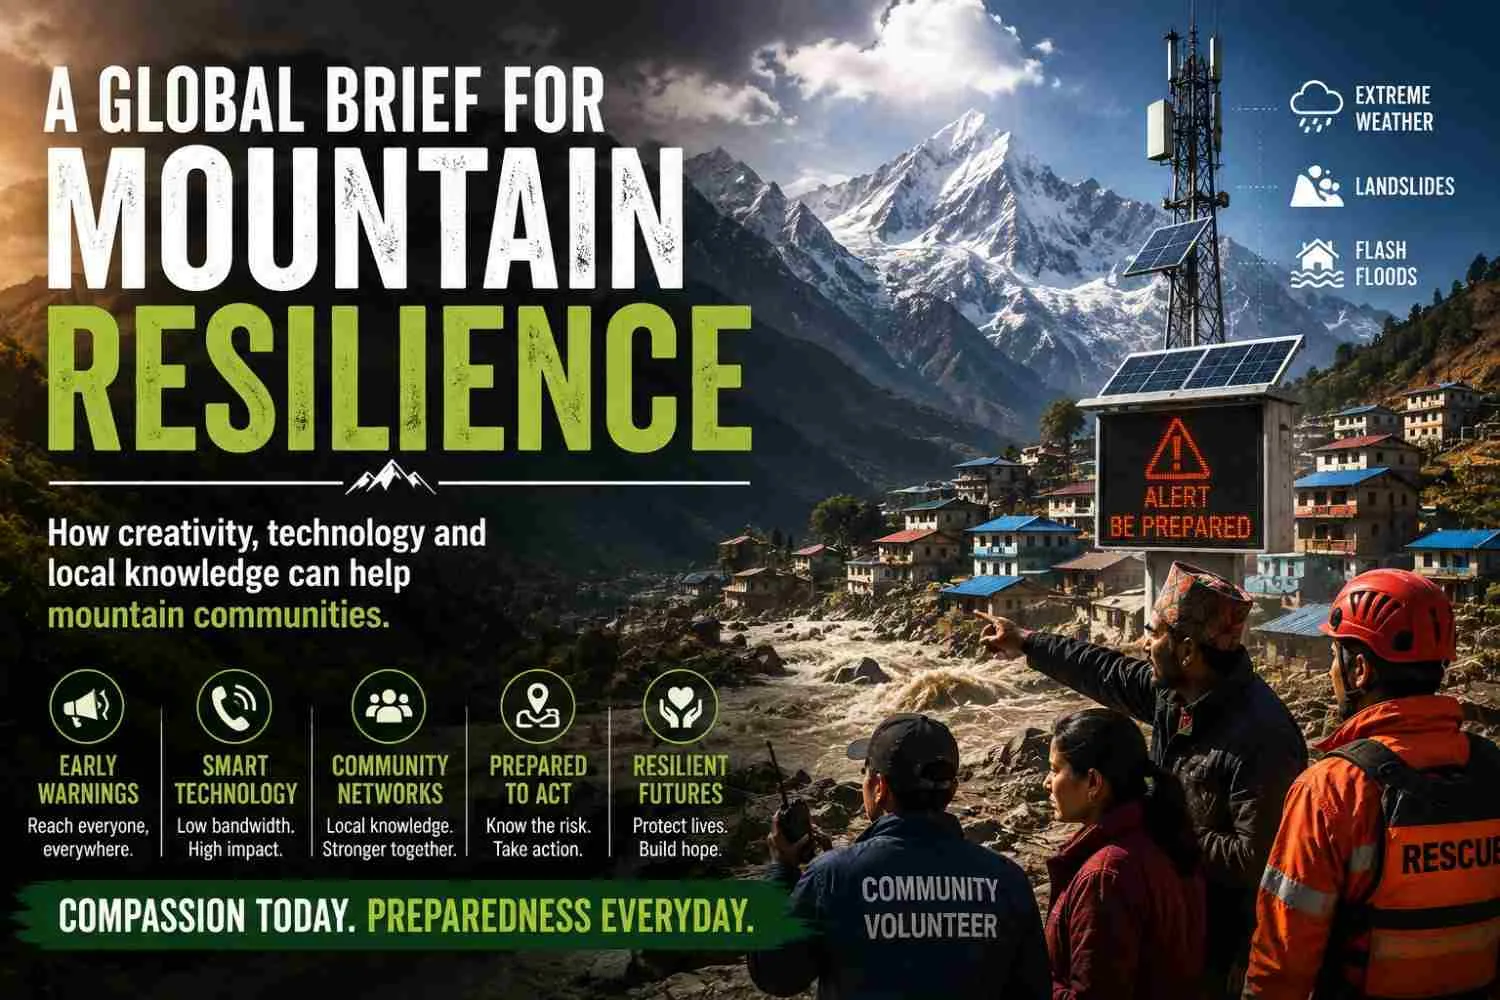
The Himalayas are not merely a development frontier. They are a living ecological system. Nepal’s 2026 debris disaster exposes the urgent need to put ecology, carrying capacity, local livelihoods and resilience at the centre of Himalayan development.SummaryNepal’s August 2026 debris disaster shows how fragile Himalayan landscapes can turn infrastructure and human exposure into catastrophe. The article argues that climate change is increasing background risks, but poor planning, construction and weak warning systems determine the scale of damage. An ecology-first approach would prioritise restoration, responsible tourism, resilient infrastructure, local livelihoods and stronger cross-border data sharing. Examples from Bhutan and Sikkim demonstrate how tourism, conservation and community-based economies can be aligned rather than treated as competing priorities. The central message is clear: Himalayan development must protect the ecological systems that sustain security, livelihoods, water and long-term prosperity.How creativity, technology and local knowledge can help mountain communities.The devastating disaster in Rasuwa and surrounding areas of Nepal has left lives lost, families grieving, people missing and communities facing a difficult journey towards recovery. Nepal needs the prayers and support. But it also needs something that must begin before the next disaster: PREPAREDNESS.Following the tragedy, I wrote an appeal asking the Global Advertising, Branding, Marketing, Media and Technology Communities to help protect Mountain Communities. The response from friends and colleagues around the world reminded me that compassion has no borders.But compassion must now lead to collaboration.Our Prime Minister Balendra Shah has also called upon the international community to recognise the growing risks facing the Himalayan region. He described the Rasuwa disaster as a serious indication that these risks are increasing alongside climate change and stressed that managing the effects of a global crisis must be a shared international responsibility.This is an important global appeal. My appeal is to our community: The people who understand attention, behaviour, communication, storytelling, design, media and technology. It is an appeal to our creative and technology ecosystem.Climate risk is also a Communication Challenge. Mountain communities are living with increasing uncertainty. Glacial instability, flash floods, landslides, extreme rainfall and unpredictable weather are placing lives, livelihoods and infrastructure at risk. What happens in the mountains does not remain in the mountains. The Himalayas feed river systems that support drinking water, agriculture, energy, tourism, trade and economies beyond national borders. When mountain ecosystems become unstable, the human consequences travel far downstream. Yet mountain communities often live in places where communication is most difficult. Internet access may be limited. Mobile networks may become unavailable. Messages may need to cross different languages, cultures and different levels of literacy.Important scientific knowledge exists. Risk assessments are produced. Weather and environmental data are collected. But information does not save lives simply because it exists. It must reach people in time. It must be understood. It must be trusted. It must help people know what to do next. A warning filled with technical language may be accurate but still fail to create action. A mobile alert may arrive but mean little if a family does not understand the level of danger. An evacuation route may exist but remain unknown to the community expected to use it.The challenge therefore, is not only to predict danger. It is to transform information into Preparedness. Our industry solves communication problems every day. We simplify complex messages and communicate across cultures. We use design to guide behaviour, storytelling to create emotional understanding and media technology to reach people at scale. We study audiences, identify barriers and create messages intended to move people from awareness to action.What if we applied those abilities to one of the most urgent challenges facing the world? How can creativity, communication, media and technology help mountain communities understand risk, prepare earlier and act faster? This is not a traditional advertising brief. There is no product launch, sales target or market share objective. The desired response is not simply an advertising campaign about climate change. It is a practical system of ideas that can help people before and during an emergency. The work might help answer questions such as:How can an early warning be understood immediately, regardless of literacy?How can alerts reach people in areas with limited internet access?How can families know where to go and what to carry during an evacuation?How can schools, tourism businesses, transport operators and community leaders become part of a local warning network?How can verified information travel faster than rumours during a crisis?How can preparedness become part of everyday life?Technology companies can help build location-based, multilingual and low-bandwidth warning systems. Telecommunication companies can help urgent information reach people quickly, including those without smartphones. Brands can contribute through their distribution networks, packaging, retail relationships and presence in remote communities. Media organisations and creators can amplify verified information, reduce confusion and ensure that mountain communities remain visible after the immediate headlines disappear. Creative agencies can transform scientific information into clear visual guidance, memorable messages and culturally relevant tools. Creative festivals, award programs and industry associations can introduce open briefs focused on mountain resilience and disaster preparedness. Instead of recognising ideas only after they have become campaigns, they can help create the partnerships from which useful solutions emerge. Climate scientists, disaster specialists, government institutions and humanitarian organisations must provide the knowledge and technical guidance behind these efforts.Mountain communities must help lead the process. People living in mountain regions possess generations of knowledge about their landscapes, rivers, weather patterns and local warning signs. They must be partners in defining the problem, shaping the communication and testing whether an idea works in real life. Technology can strengthen local knowledge but it should not replace it. Data may help anticipate danger but trust determines whether people act. The best creative response may not be the most technologically sophisticated. It will be the one people can access, understand, trust and use at the moment it matters most.An open invitation from NepalI would like to invite Creative Agencies, Brands, Technology Platforms, Media Organisations, Industry Bodies, Climate Experts and Humanitarian Partners to explore an open collaboration for mountain preparedness.Could we create a shared creative brief?Could we bring regional and global creative talent together with scientists and mountain communities?Could we develop open-source solutions that different communities can adapt?Could our industry platforms create space for this conversation?Rasuwa is the immediate reason for this appeal. But Rasuwa must not become another tragedy that receives global attention for a few days and is then forgotten. It should become a warning and perhaps the beginning of a new kind of collaboration. Our industry has always responded to briefs about growth, reputation, engagement and transformation. We have used our creativity to sell products, build brands and shape culture. Today, we must ask whether some of our greatest abilities can also be used to build Preparedness.Because the next important brief may not ask us to make people buy something.It is asking us to help people understand something. It is asking us to help communities act sooner. It is asking us to help protect lives.About the writer:Ujaya Shakya is First Vice President of the Advertising Association of Nepal (AAN), Founder of Outreach and author of Brandsutra (2015) and Brandsutra 2.0 (2026) ...Read more

03 Sep 2026

India’s traditional ecological wisdom reveals how communities once read changes in trees, flowers and seasonal cycles as early warnings of environmental stress.  SummaryFor generations, Indian farmers, forest dwellers and indigenous communities observed plants, animals, soils and seasonal changes to understand environmental conditions. The article explores how this knowledge became embedded in local languages, folk sayings and seasonal traditions, using trees such as jamun, mango, mahua, palash, tamarind, neem and bamboo as examples. It explains that while traditional beliefs cannot always be treated as scientifically accurate forecasts, some observations may reflect real biological responses to moisture stress, temperature changes and seasonal shifts. The discussion of bamboo flowering and the Mautam phenomenon shows how traditional observations can sometimes align closely with modern ecological research. The article argues that such knowledge should neither be accepted blindly nor dismissed as folklore, but studied alongside modern science and environmental monitoring. Ultimately, it asks whether India can preserve this biocultural knowledge as a useful way of understanding changing ecosystems. This summer, Indian orchards and fruit markets seem unusually generous. Jamuns are arriving in quantities that many people say they have not witnessed in decades. Mango orchards in several regions have yielded heavily. Only a few weeks ago, forest floors across central India were carpeted with heavenly mahua flowers, while palash transformed entire landscapes into seas of orange-red flames. In rural areas, such abundance is still not viewed merely as a gift of nature, rather It is treated as a deep-rooted message from nature. For centuries, Indian communities practiced what may be called a form of ecological forecasting. Long before satellites, meteorological models, or groundwater monitoring networks, farmers, pastoralists, forest dwellers, and indigenous communities learned to observe subtle changes in plants, animals, soils, and seasonal cycles and interpreted in their own tongue. These observations evolved into a rich body of traditional ecological knowledge through which communities attempted to anticipate droughts, floods, pest outbreaks, and other environmental disruptions. While modern science may not validate every traditional belief, many of these observations emerged from generations of intimate engagement with landscapes. The lexicon of interdependence, encoding how native communities linguistically locate themselves with material cycles of flora, water, and sustenance. The Curious Case of the Jamun  The unprecedented jamun (Syzygium cumini) productivity this year has revived an ethnoecological axiom embedded in the linguistic fabric of eastern Uttar Pradesh and Bihar that encodes an observed ecological pattern.  "Jamun phale aghaay, paani rahe ghataay."   The underlying intuition is intriguing. Whether this saying is universally true is less important than the ecological insight behind it. Language becomes diagnostic, mediating human interpretation of ecological signals, thereby marking the convergence of ecological observation with linguistic codification. Jamun has a tap root system, a deep-rooted tree capable of accessing groundwater reserves deeper beyond the reach of many plants. Traditional observers believed that unusual fruiting reflected changes occurring beneath the surface; forthcoming water stress long before it became visible to people. Modern plant science does not support the notion that trees can predict the future, yet it does show that many species allocate more energy and resources to flowers, fruits, and seeds to increase the likelihood that its lineage will survive difficult conditions.  Moisture stress, temperature anomalies, and changing climatic conditions can influence flowering and fruiting patterns. Botanists refer to related phenomena as mast seeding, stress-induced reproduction, or reproductive allocation under stress. In this sense, trees may not foresee droughts, but they often respond to environmental pressures much before even humans notice them. Mango and the Memory of Dry Winter The same ecological sensitivity is reflected in traditional observations for the national fruit, the mango (Mangifera indica), across India. Across large parts of northern and central India, farmers have long watched the intensity of mango blossom. In Bundelkhand, one still hears the saying,  “Aam ke phool ghane, garmi pade tani seene.” Dense mango flowering often heralds a severe summer. The saying is both a linguistic artifact and an environment instrument. Moreover, this can be interpreted as a case of ecological semiotics, where flora becomes the signifier and the saying acts the interpretive code. Next, Horticultural science offers an interesting parallel. Mango flowering is known to be influenced by dry conditions and moisture stress during preceding months. Thus, what villagers interpreted as a warning may actually have been an observation of the same environmental signals to which the trees themselves were responding. Mahua: The Tribal Calendar Tree  Among forest communities of central India, mahua (Madhuca longifolia) occupies a special place as both a livelihood resource and a seasonal indicator. Elders among Gond, Baiga, and Oraon communities often viewed exceptionally heavy flowering as a sign that nature was preparing for uncertain times. In the tribal heartlands the onomatopoeic phrase ‘Tipr Tapr’is use to describe the distinct sound of sweet mahua flowers raining down onto the forest floor.  Perception among the native population,"when mahua flowers profusely, the earth still remembers its thirst, captures a perception that environmental stress and reproductive abundance are somehow linked. A particularly abundant flowering season often encouraged families to store more produce, reflecting an expectation that difficult times could lie ahead.  Whether scientifically verified or not, the observation emerged from centuries of indigenous community close engagement with local ecosystems. In the same line The tamil saying  Aalai illaa oorukku iluppaip poo charkkarai  captures role of vital food safety net during stress; when primary resources or sweeteners are completely unavailable, the high natural sugar content of the mahua flower saves the community.   Palash and the memory of hot summer The flowering of palash (Butea monosperma), popularly known as the ‘Flame of the Forest’, occupies a similar place in seasonal memory. Across central and east India, the spectacular flowering of palash has long been associated with the arrival of the hottest and driest period of the year.  Palāś phūlā, garmī ā’ī The folk rendering ‘when palash sets the forest aflame, fierce heat follows’, does not predict drought so much as it marks an approaching phase of environmental stress. This environmental shift finds deeper, poetic resonance across neighbouring cultures. Bengali folk memory warns   Polash phutle phagun ashe, porei jyoishther roddur hashe  noting that while the brilliant orange introduces the spring month of Phagun, it serves as an immediate threshold to the cruel summer sun of Jyoishtha. Simultaneously, Odia rural wisdom sounds a visual alarm through the couplet  Palasha bana jalile, nai nala sukhile mapping the fiery ignition of the forest canopy directly to the drying up of local rivers and rivulets. Also, such a proverb becomes a case of environmental semiosis where the forest becomes the sign, fire becomes metaphor, and heat becomes semantic consequence. Such ethnobiological cues helped communities prepare for changing seasonal conditions long before thermometers and weather forecasts became commonplace. Cross-country wisdom Similar ecolaxicon traditions appear far beyond the Hindi-speaking belt, relying on shared community insights rather than strict, word-for-word dictums. In the Telugu region, farmers have long observed that unusually heavy fruiting of tamarind (Tamarindus indica) can precede a difficult summer; drawing on this experience, elders often summarize this intuition through paraphrased concepts like  “Chinta ekkuva kaaste, vesavi kathinam” observing that when tamarind bears excessively, the summer is bound to turn exceptionally severe. In Karnataka, a comparable piece of rural wisdom survives in the shared understanding often paraphrased as  “Hunase tumba bandre, neeru kadime” indicating that an abundant tamarind harvest naturally accompanies a sharp decline in water availability. In both regions, these localized summaries reflect a deep-rooted awareness of the hardy tree's biological survival mechanism, which accelerates seed production under acute environmental stress.  In Gujarat's Saurashtra region, indigenous weather forecasters historically regarded exceptionally heavy fruiting of neem (Azadirachta indica)as a possible indicator of drought, expressed in the saying  "Limdo ghano phale to dukaal pade." When neem fruits heavily, drought may follow. Even jackfruit, one of India's most productive seasonal trees, finds a place in local ecological memory.  In parts of Kerala and the Western Ghats, older farming communities sometimes regarded extraordinarily heavy jackfruit (Artocarpus heterophyllus) seasons as a sign of climatic irregularity, particularly when accompanied by unusual heat or delayed rainfall. Rather than a canonical proverb, these locally circulated expressions show how everyday speech can store ecological observations in compressed form. Bamboo and the Warning  Yet perhaps the most remarkable example comes from the hills of Mizoram. For centuries, Mizo communities feared an event known as Mautam. In the Mizo language, mau means bamboo (Bambusa vulgaris) and tam refers to a devastating period of famine. The term describes the mass flowering of bamboo that occurs roughly every half-century. Traditional knowledge held that bamboo flowering would be followed by food shortages. The association between bamboo productivity and rodent outbreaks appears not only in Northeast India but also in traditional forecasting compilations from western India reflected in Gujarati  "Vans vadhare phale, undar vadhe."  meaning when bamboo thrives unusually, rats increase. For many years, this belief was dismissed as folklore. Scientific research later demonstrated that bamboo flowering produces enormous quantities of seeds, triggering population explosions among rodents. Once the seeds are exhausted, rat populations move into agricultural fields and grain stores, destroying crops and causing widespread hardship.  Language encodes ethnoecological data by incorporating observed correlations between phenology and climatic outcomes into linguistically encoded transmissible knowledge.  The Ecology of Observation What is particularly striking about these diverse traditions is that they were rarely based on a single observation. Farmers and forest communities interpreted plant behaviour alongside changes in groundwater levels, bird migrations, insect activity, wind patterns, and the timing of seasonal events. Together, these formed a decentralized environmental monitoring system refined over generations. Language becomes the medium through which this decentralized system is stabilized and transmitted informally generation after generation . It does not merely record the ecology of observation; it processes, stores, and projects. It documents observation and makes vernacular speech an ecological model across generations. The observations may not always have been accurate, but they reflected a sophisticated understanding that humans are part of larger ecological networks and that environmental change often announces itself through subtle biological signals through plants. Modern science increasingly recognizes that plants are among the most sensitive responders to environmental change. Variations in groundwater, soil moisture, temperature, and seasonal timing can alter flowering and fruiting patterns long before the consequences become visible to people. This does not mean that every bumper crop predicts drought or every profuse flowering foretells crisis. Also, traditional communities noticed this early, and language formed the tool that captured the biological signals. Nature is rarely so simple. Yet it does suggest that traditional communities may have been observing real ecological relationships, even when their explanations differed from those of contemporary science. As India confronts groundwater depletion, intensifying heat waves, erratic monsoons, and growing climate uncertainty, these traditions deserve neither blind acceptance nor casual dismissal. Instead, they invite a fresh look of biocultural architecture where language, environment and people intersect and treasure the repository of our survival. They remind us that landscapes are constantly communicating through the plants, animals, and seasonal rhythms around us in the native lexicon; ecolexicon. The abundance of jamuns, mangoes, mahua flowers, jackfruits, tamarinds, or neem fruits may not provide a precise forecast of the future. But they may still be telling us something important about the environmental stresses unfolding around us. The question is whether we still know how to listen the echoes of nature?ABOUT AUTHOR                                                         Prof. Dr. Kushagra RajendraMobile: 9650913635Head of Dept. UGC-Master Trainer IKS Columnist Environmental & Sustainability -- Amity University Haryana, India   Prof. Devina Krishna (linguist) Dept. of English, Patna Women's CollegeShe mainstreams in language, ecology, and culture.  ...Read more

03 Sep 2026

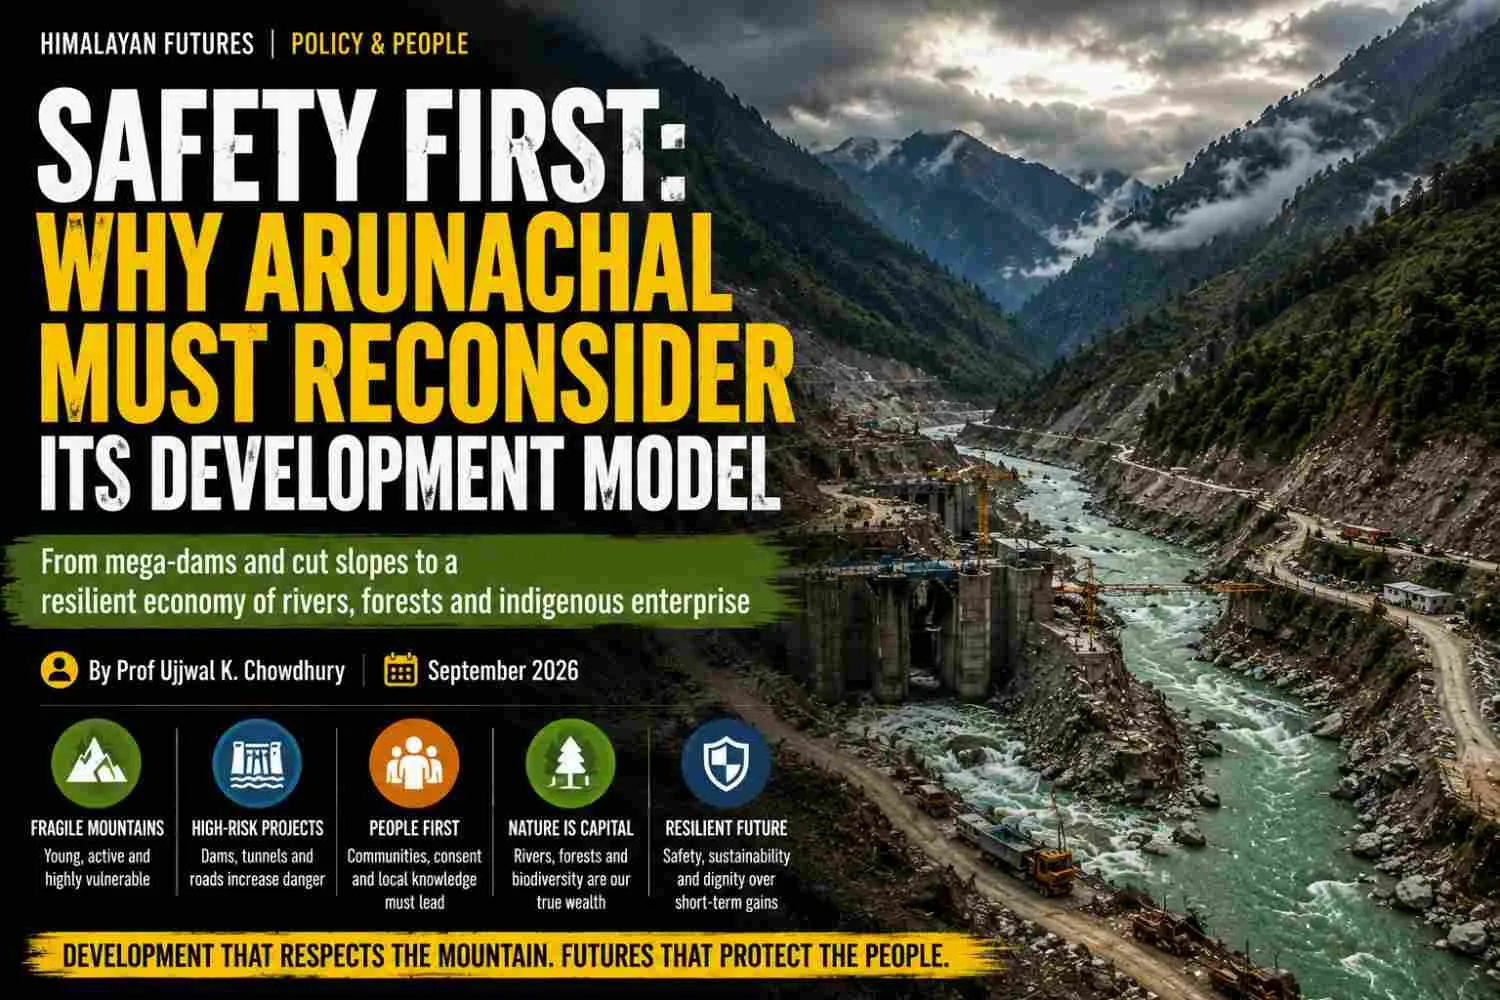
From mega-dams and cut slopes to a resilient economy of rivers, forests and indigenous enterpriseSeptember 2026 Arunachal Pradesh faces a critical development choice as hydropower, roads and large infrastructure projects expand across a fragile Himalayan landscape. The article calls for a safer model built around resilient communities, local livelihoods and ecological limits. SummaryArunachal Pradesh’s rapid infrastructure development is bringing roads, hydropower and other projects into a landscape shaped by steep slopes, seismic activity, intense rainfall and growing climate risks. The article argues that development cannot be judged only by megawatts generated, kilometres of roads built or investment attracted, but also by safety, ecological impact and community well-being. It examines concerns around projects such as Upper Siang and Etalin, including displacement, forest diversion, biodiversity loss and the risks of building in vulnerable river basins. At the same time, it presents alternatives centred on community tourism, value-added agriculture, local energy systems and indigenous enterprise. The proposed approach places local communities, customary institutions and ecological resilience at the centre of development decisions. Ultimately, the article calls for an Arunachal model that delivers stronger livelihoods and public services without increasing long-term exposure to environmental and climate risks. THE PROPOSITIONArunachal Pradesh does not have to choose between poverty and peril. It has to choose whether its rivers, forests and cultures will be treated primarily as national inputs, or as the living capital of a safer, higher-value local economy. The glacier-and-rock collapse reported in Nepal, the warning from Sikkim and Arunachal's own contested hydropower trajectory make that choice urgent. The Himalayas do not announce a disaster only when a dam breaks. They announce it through a spring that disappears after a tunnel is drilled, a road that slips every monsoon, a river whose sediment no longer reaches downstream fields, a village whose consent is counted only after the map is final. Arunachal Pradesh is at the point where these signals have to become policy. The mountain is not an empty balance sheet The most important fact about Arunachal Pradesh is also the fact most development plans suppress: it is a young mountain system still being made. Steep slopes, fractured rock, intense monsoon rainfall, active faults, fragile soils and a changing cryosphere respond to every road cut, tunnel, quarry, reservoir, settlement and drainage alteration. The three Counterview articles place this reality beside the August 26, 2026 glacier-and-rock collapse reported along the Nepal-Tibet border. A high-mountain failure became a debris flow, flood, infrastructure destroyer and humanitarian crisis downstream. The trigger was geological and cryospheric; the scale of loss was shaped by what had been built in the path of risk. Climate change changed the structure of risk by weakening ice, destabilising slopes, altering rainfall and making old design assumptions unreliable. Arunachal shares the conditions that make the Nepal event a warning: high seismicity, steep river valleys, expanding glacial lakes, cloudbursts, landslides and difficult emergency access. It has also experienced its own cloudbursts, road failures and district isolations. A road celebrated at inauguration but not maintained through the monsoon is not durable connectivity. A dam that multiplies a debris surge is not automatically a resilience asset. The question, therefore, cannot remain: how quickly can Arunachal add megawatts, kilometres of road and concrete? It must become: developed for whom, with what exposure, and at what price to the families who will live on these slopes fifty years from now? When infrastructure becomes exposure For two decades, Arunachal's development story has been narrowed into a familiar template: large hydropower projects for the national grid, strategic roads across unstable terrain, tunnelling through mountains and the rapid conversion of rivers into infrastructure corridors. The needs are genuine - roads, hospitals, schools, communications, jobs, energy and border security. But genuine needs do not make every engineering response wise. Upper Siang and Etalin are the clearest tests of that wisdom. The proposed Siang Upper Multipurpose Project, often described as an approximately 11,000 MW project, and the 3,097 MW Etalin project in the Dibang basin sit in landscapes that are seismically active, biodiverse and socially sensitive. Their proponents may present national power, flood moderation or strategic value; critics see high-consequence exposure in valleys where evacuation, rescue and compensation would be extraordinarily difficult. Project-by-project clearance is not enough when the river basin is the real unit of impact. A dam, access road, transmission corridor, tunnel, quarry and downstream cascade operate as one system. Blasting disturbs slopes and springs; hill-cutting changes drainage; a landslide can block a river, send an impulse wave into a reservoir or sever a village road. A GLOF or debris flow can breach a large structure and magnify the downstream disaster. Tofu-dreg infrastructure - built too quickly or cheaply for its setting - is a governance warning. The ecological bill is equally serious. Reservoirs submerge forests, fragment habitat, trap sediment and alter fisheries, riverine agriculture and downstream geomorphology. High-head barriers obstruct migratory fish; decaying biomass can release greenhouse gases. A centralised plant is also a single point of failure: if its powerhouse, transmission line or bridge is cut, the distant grid and the local community may lose power together. Sikkim offers a caution that Arunachal should not dismiss. The third Counterview article notes that the National Remote Sensing Centre assessed a 42 per cent probability of a South Lhonak Lake breach in 2013. On October 3-4, 2023, the lake breached; the Teesta III dam at Chungthang was destroyed, 55 people died, 74 went missing, more than 7,000 people from 1,756 families lost their homes, and thousands of houses were damaged across Sikkim. The reported proposal to rebuild at the same location, with a structure almost twice as high, illustrates the danger of treating a known risk as a reason for taller concrete rather than better land-use decisions. The missing people in the numbers The Upper Siang debate reveals why displacement cannot be reduced to a compensation spreadsheet. Project-side accounts cited in the dossier speak of around 16 villages and roughly 10,000 people directly affected. Community organisations and researchers speak of at least 27 villages, a 40-300 village impact zone and more than 150,000 people, depending on whether farmland, forest access, fisheries, grazing, sacred sites and downstream livelihoods count. The disagreement asks who is visible to the state. For the Adi people, the Siang is not an empty channel with a calculable flow. Ane Siang, the Mother Siang, is a cultural and ecological relationship. A village contains homes, terraces, orchards, fishing grounds, mithun routes, burial places, ritual spaces, memories and kinship networks. A resettlement colony can reproduce houses, not a river's meaning or the social geography through which knowledge travels. Compensation cannot restore a place-based civilisation. Etalin presents a smaller numerical footprint with the same principle. Project documents cited in the dossier indicate about 265 families in eight affected villages, with around 95 families facing involuntary displacement, while the project requires diversion of roughly 1,175 hectares of forest land. The project's environmental clearance has also faced legal challenge. Whether one supports or opposes the project, the lesson is clear: the burden of proof must rise when the cost is irreversible. Indigenous resistance to Upper Siang and Etalin is not an obstacle that publicity can remove. Adi institutions, farmers' forums, youth groups and human-rights advocates question consent, cultural survival, safety and benefit-sharing. Some affected families and village groups support the projects for expected flood protection or economic opportunity. That diversity makes independent deliberation essential. A signature after the design is fixed is not free, prior and informed consent. WHAT THE UPPER SIANG NUMBERS REVEALOfficial or project-side accounts cited in the dossier: about 16 villages and roughly 10,000 people directly affected. Community and civil-society accounts: at least 27 villages, a wider 40-300 village impact zone and more than 150,000 people. The gap is not a licence to choose the largest figure; it is evidence that the definition of 'affected' must include land, forests, rivers, culture and downstream livelihoods. A moratorium is a responsibility, not a rejection of development Arunachal should declare a time-bound moratorium on new large storage dams and high-risk cascades in the most vulnerable basins. This would create space for independent, cumulative assessments that model earthquakes, GLOFs, landslide impulse waves, sediment, extreme rainfall, upstream operations and failure of roads and communications together. The state needs a public hazard atlas. No-go zones should cover the highest landslide and GLOF susceptibility areas, irreplaceable biodiversity corridors and sites where evacuation is implausible. Low-no zones should permit only light, reversible or strictly conditioned activity. Settlements and critical assets already at risk need voluntary relocation or retrofitting, with land, services, transport and livelihoods planned together. Early warning is a social system, not a dashboard. Satellite and AI tools, weather radar, rain gauges, glacial-lake sensors, river gauges and slope monitors matter only if a village receives a clear alert, knows the safe route and practises the drill. Data-sharing across the India-Bhutan-China-Nepal Himalayan arc should be pursued wherever diplomacy allows. Roads and bridges should follow mountain behaviour: drainage first, slope bioengineering, vegetation reinforcement, controlled spoil disposal, spring protection, geotechnical inspection and dedicated maintenance. Vetiver, alder, bamboo and hydroseeding should complement engineering. The most strategic road may be the one that remains open and repairable, not the widest on inauguration day. Quality of life is the unit of progress A safer development model must answer everyday questions: can a child study during a monsoon outage, can a pregnant woman reach care, can a farmer sell without distress, can an elder remain in a familiar community, can a young person earn without leaving, and can a family sleep without fearing the next slope failure? These are the real measures of resilience. A safe home is infrastructure: Retrofit vulnerable homes and support voluntary, culturally appropriate relocation from the highest-risk zones. Promote earthquake-resilient construction using bamboo, cane, timber and local design knowledge wherever technically suitable.A reachable service is development: Combine district hospitals with telemedicine, mobile health units, emergency transport protocols and digital classrooms, so people need not be concentrated in unsafe places simply to reach a service.A maintained road is better than a grand road: Use geotechnical routing, drainage, bioengineering and slope monitoring. Limit widening, protect springs and accept seasonal or low-capacity routes where necessary. Budget maintenance as a core asset, not a post-disaster appeal.Local energy is strategic energy: Combine safe micro-hydro, rooftop solar, storage and islandable microgrids so border villages, schools, clinics, communication nodes and emergency centres remain powered when landslides cut the main line.  Tourism that pays the village The alternative to mega-project dependence is an economy that earns more from each unit of landscape without consuming it. Tourism can be a pillar, but Arunachal should avoid the familiar sequence in which roads arrive, hotels multiply, waste and water stress follow, and the host community receives the least value. Build high-value, low-density tourism around certified homestay clusters and community lodges regulated by village institutions or Kebangs. Publish carrying-capacity studies before scaling visitors, and use permits, seasonal quotas and route zoning for high-altitude lakes, glacial passes, sacred sites and wildlife corridors. Access must fit slope stability, water availability, cultural dignity and emergency capacity. The product should be experiential: Eaglenest birding, alpine botany, high-altitude treks, monastery and living-heritage circuits in Tawang and West Kameng, cultural and culinary immersion, river interpretation, farm stays, harvests and festivals. Tawang, Ziro, Mechuka, Namdapha and Pasighat can develop distinct identities. Kaimoi's Best Tourism Village recognition and work in Namsai show that cultural revival can be an economic asset. Room revenue, guide fees, permits, conservation fees and craft sales should flow to village committees and households. Cooks, drivers, porters, performers, farmers and artisans should be named beneficiaries. Training should cover hospitality, first aid, rescue, waste, digital booking, language and storytelling. Homestays need water, sanitation, fire, waste and structural standards without being forced to imitate urban hotels. The Lower Subansiri pondage proposal - a controlled tourism, adventure, cultural and inland-fisheries hub - deserves a transparent feasibility test. Reusing an altered site may be preferable to opening new upstream valleys, if safety, carrying capacity, fish ecology and community ownership are secured. Tourism must be a conservation contract: visitors receive meaning, communities receive income and ecosystems receive limits. Agriculture must leave as a product, not a truckload Agriculture should not leave Arunachal only as a truckload of unprocessed produce. Its microclimates can support a premium basket of kiwi, mandarin oranges, pineapple, apples, persimmon, walnuts, large cardamom, ginger, turmeric, chillies, buckthorn, medicinal plants, millets, Khamti rice, yak churpi and distinctive beverages. APEDA's buyer-seller work at Tawang points toward FPOs, FPCs, women's Self-Help Groups, branding, exports and value addition. The missing layer is a distributed system that lets farmers retain more value. Each producing cluster should have small solar-powered processing and packing capacity: grading, pulping, juicing, drying, pickling, fermentation, spice processing, safe packaging and traceability. Five- to ten-tonne community cold rooms can prevent distress sales when landslides block roads. A brand such as Arunachal Organic Himalaya can sit above district and tribal brands only if certification, quality control and producer ownership are real. Geographical indications should protect and premiumise distinctive products, not merely decorate packaging. Farmer Producer Companies should negotiate directly with urban retailers, hotels, institutions and exporters. Digital catalogues can show harvest windows, volumes and quality; public procurement can place local produce in schools, hospitals and tourism kitchens. Finance must cover working capital, cold chains and packaging. Women-led processing, food entrepreneurship and local logistics can create jobs without forcing young people to leave. Climate-smart agriculture should strengthen, not erase, local knowledge. Jhum should not be eliminated by decree; improved fallows, contour planting, water harvesting, agroforestry and community fire management can reduce erosion while preserving food cultures. Nitrogen-fixing alder, Alnus nepalensis, can be integrated with heirloom tea and black pepper. Success is a productive hillside that keeps soil, water, biodiversity and income together. Healing landscapes, not resort landscapes Arunachal's forests, clean air, hot springs, highland climates and spiritual traditions can support a careful nature-wellness economy. This is not a licence for large resorts. It is an invitation to design small, regulated experiences: forest-bathing or Shinrin-yoku trails, meditation retreats, monastery stays, nature-therapy walks, restorative food and hot-spring facilities with strict water and waste limits. Guides should be trained in ecology, mental-health first response, visitor safety and the limits of therapeutic claims. Indigenous dietary, herbal and healing knowledge must be documented with consent and benefit-sharing. Cooperative processing of managed non-timber products such as Mishmi teeta, wild turmeric or Taxus-related resources must prevent overharvesting and bio-piracy. Wellness should complement, never replace, public healthcare. Craft and local design as a living economy The cultural economy should be a productive sector, not an annual festival display. Apatani, Adi, Nyishi, Monpa and other weaving traditions; bamboo, cane and beadwork; Monpa paper; thangka and Buddhist art; and Wancho wood carving carry design intelligence. The challenge is repeatable income without flattening distinct identities into one generic Northeast aesthetic. District craft and design hubs can provide shared tools, natural-dye research, photography, packaging, e-commerce, accounting and market access. Partnerships with design institutes, fashion labels, architects and responsible retailers must protect attribution, intellectual property, fair prices and artisan control. A digital maker passport can connect each product to its maker, village, technique and material story; tourism circuits can add demonstrations, workshops and direct sales. Bamboo and cane bridge heritage with climate resilience. Bamboo anchors soil and can support homeware, furniture, structural alternatives and earthquake-conscious vernacular housing when engineered properly. Documentation and apprenticeships are vital: if craft is poorly paid, the state loses both a livelihood and an irreplaceable knowledge archive. A VILLAGE POWER TEMPLATEIllustrative 500 kW community-owned run-of-the-river model: 800-1,200 households and local institutions served; about Rs 4.5-5.5 crore capital cost; roughly 2.6 million kWh annually at 60 per cent capacity factor; customary council as trustee; Village Energy Management Society with women and youth representation; 35 per cent of revenue for O&M, 25 per cent for debt and 40 per cent for capital reserve, social dividend and watershed protection. Final feasibility, tariff and safety decisions must remain site-specific. Power where people live Arunachal's energy security does not require every river to become a gigawatt corridor. Safe run-of-the-river micro-hydro units, generally 10 kW to 2 MW, combined with solar and storage, can provide power close to where people live. Lower head, negligible storage and small civil footprints can reduce the scale of failure compared with a large reservoir, while allowing community ownership. No micro-hydro site is automatically safe; every site needs hydrology and geotechnical review. An illustrative 500 kW community-owned project could serve 800 to 1,200 households, schools, clinics and micro-enterprises. The dossier models a capital cost of Rs 4.5-5.5 crore and, at a 60 per cent capacity factor, around 2.6 million kWh a year. A customary council - Kebang, Tsumok or equivalent - can hold the land and water-use trust. A Village Energy Management Society can run the plant, with elders, a technical representative, local youth technicians and at least 50 per cent women and youth representation. Local operators should flush abrasive silt traps during the monsoon; four village youths can become primary and apprentice 'barefoot engineers'; the turbine maker can provide an annual maintenance contract; and prepaid smart metering can remove billing friction. A workable financing stack could blend 60 per cent public subsidy, 20 per cent CSR or green-climate finance, 15 per cent concessional debt and 5 per cent community land and labour. Tariffs can protect dignity and reliability: a lifeline domestic rate, a higher commercial rate for homestays and processing, and a regulated feed-in price for surplus. The illustrative revenue waterfall allocates 35 per cent to O&M, 25 per cent to debt service and 40 per cent to resilience - 15 per cent capital reserve, 15 per cent village social dividend and 10 per cent catchment protection. Energy then runs dryers, kiwi sorting lines, grain mills, five- to ten-tonne cold rooms and local EV charging hubs. The ten decisions that can change Arunachal's trajectory The state government can turn the argument into a social contract through ten decisions over the next 24 months. The sequence matters: first reduce irreversible exposure, then build the institutions and markets that make safer livelihoods credible. Pause new large storage dams and high-risk cascades while independent basin studies examine seismicity, GLOFs, landslides, sediment, climate projections and dam-break cascades.Create a public hazard atlas with no-go and low-no zones for heavy infrastructure, biodiversity corridors and high-risk settlements.Install real-time glacier, lake, rainfall, river and slope sensors in districts including Tawang, Dibang Valley and Anjaw, linked to village sirens, drills and last-mile communication.Make cumulative impact assessment and public disclosure mandatory for roads, tunnels, quarries, transmission lines and hydropower.Create a permanent Mountain Maintenance and Resilience Fund for drainage, bioengineering, bridge inspection, road restoration, emergency stocks and local responders.Launch district missions for community tourism, organic value chains, craft, design and nature wellness, with low-interest finance, procurement and ecological standards.Give FPOs, FPCs, women's SHGs, artisan guilds and tourism committees direct access to markets, digital systems, training and working capital.Adopt an enforceable FPIC-like protocol: disclose alternatives, recognise customary institutions, record dissent and share risks and benefits before decisions are final.Build decentralised energy around safe micro-hydro, solar, storage and islandable microgrids, with community, women and youth governance.Measure progress through disaster losses, forest cover, water quality, green-sector income, youth retention, service access and community satisfaction alongside GDP and capacity.  A future measured in more life per unit of concrete Arunachal does not face a binary choice between dams and poverty. It faces two theories of development. One treats the state as a resource warehouse whose rivers are exported, slopes cut faster than they heal and people compensated after decisions. The other treats mountains as the foundation of a local economy: forests that protect water, rivers that sustain culture and fisheries, farms that earn through processing, villages that host visitors on their terms, crafts that carry identity and energy systems that keep communities resilient. National security is not weakened by this second theory. A village with safe housing, a clinic, a digital classroom, a community microgrid, trained responders, maintained roads and dignified livelihoods is stronger than a landscape tied to one vulnerable transmission corridor. Ecological protection and strategic presence can reinforce each other when people are custodians and partners. The Nepal disaster, the Sikkim precedent and Arunachal's monsoon failures are not prophecies. They are choices made visible in advance. The government can still pause, listen, map, maintain and diversify. The goal is more safety, income, health, culture and possibility with less ecological damage. In a fragile Himalaya, that is the only progress that can endure.  Sources and editorial note Wangchuk Tsering. Safety first: Why reconsider hydropower in fragile Arunachal. Read online Neha Desai. Why the Nepal disaster is a warning Arunachal Pradesh cannot ignore. Read online Raj Kumar Sinha. Rising climate risks demand a new Himalayan development model. Read online APEDA / Press Information Bureau. APEDA and Government of Arunachal Pradesh host International Conclave cum Buyer-Seller Meet at Tawang. Read online APEDA. Arunachal Pradesh: GI and agricultural products profile. Read online Shiv Nadar University, Centre of Excellence for Himalayan Studies. Dams in the discourse of development: vulnerabilities and systematic barriers to communities-inclusive policies in Arunachal. Read online ...Read more

03 Sep 2026

An Appeal from Nepal to the World From a devastating disaster in Nepal’s Rasuwa district comes a wider call for action—bringing climate communication, creative industries and local mountain knowledge together to protect vulnerable communities.SummaryThe devastating floods in Rasuwa have renewed attention on the growing vulnerability of mountain communities to climate-related disasters. The article argues that the response cannot end with sympathy after a disaster; it must include stronger preparedness, clearer communication and long-term resilience. It calls on creative professionals, media, technology companies and brands to use their reach to make climate information easier to understand and act upon. At the same time, mountain communities must remain central to these solutions because their local knowledge can complement climate science and early-warning systems. The piece highlights practical needs such as multilingual alerts, accessible evacuation information and communication systems that can reach people with limited internet access. Ultimately, it presents creativity and communication as tools that can help turn climate awareness into preparedness and collective action.I want to begin with a heartfelt thank you. Since the devastating flash floods in Rasuwa and surrounding areas of Nepal, I have received messages and calls from friends and colleagues across the world. Your concern for Nepal, your prayers for those affected n your words of solidarity have meant a great deal during this painful time. These messages reminded me that compassion has no borders. They also encouraged me to make a wider appeal.Lives have been lost. Many people remain missing. Families are waiting for news, communities have been displaced and essential infrastructure has been destroyed. Nepal needs the world’s continued prayers and support. But prayers and expressions of sympathy, however meaningful, cannot be where our response ends. Alongside our grief, we must begin an urgent global conversation about Climate Change, Disaster Preparedness and the Growing vulnerability of Mountain Communities.This is more than a tragedy in Nepal. Rasuwa may be the place currently in the headlines but the warning it carries extends far beyond Nepal. Mountain regions around the world are facing increasingly uncertain environmental conditions. Glacial instability, flash floods, landslides, extreme rainfall and rapidly changing weather patterns are placing lives, livelihoods and infrastructure at greater risk. These risks do not remain confined to remote mountain settlements. Mountains feed the rivers that sustain agriculture, drinking water, energy systems, tourism, trade and economies. When mountain ecosystems become unstable, the human impact can travel across districts, countries and generations. Protecting mountain communities is therefore not a marginal concern. It is connected to the future security of millions of people.The Rasuwa tragedy must become more than another disaster that the world briefly mourns and then forgotten. It must be treated as a global warning n a call to action.Why I am appealing to the Creative Community:Climate change is rightly discussed by scientists, governments, humanitarian organisations and development institutions. Their research, expertise andleadership are essential. But climate vulnerability is also a Communication Challenge. Scientific information is often complex. Important risk assessments can remain inside reports. Early warnings may not reach vulnerable communities in time, in the right language or in a form people can easily understand. Even when information is available, people may not know what it means for their families or what action they should take. The global advertising, branding, marketing, media, design, technology and creative communities possess capabilities that can help bridge this gap.Technology platforms with global reach including companies such as Google, Meta and TikTok, could help strengthen location based and multilingual early warning communication for communities with different levels of digital access. Brands could use their distribution networks, packaging, mobile platforms, retail relationships and media reach to support preparedness in difficult to reach areas.Media organisations and content creators could amplify verified information, reduce the spread of rumours during emergencies and keep mountain communities visible after the immediate headlines have disappeared.Creative festivals, industry bodies and award platforms could introduce global creative briefs focused on mountain resilience, climate communication and disaster readiness. They could create space for agencies, brands and technologists to develop open source ideas that communities can adapt and use. Our industry knows how to capture attention. We simplify complex information, tell memorable stories and influence behaviour. We communicate across languages, cultures and different levels of literacy. We use design, data, media and technology to move people from awareness to action.Can we use these abilities to help protect human lives?No individual campaign can solve climate change. But communication can make risk easier to understand. Good design can make warnings clearer. Technology can help critical information travel faster. Storytelling can help people understand the human impact. Creativity can help move communities from awareness to preparedness. The opportunity is not to turn tragedy into a branding exercise. It is to use our professional abilities responsibly to address an urgent human challenge.Our work should help answer practical questions:Where should families go during an emergency?How can evacuation routes be communicated clearly?How can people without reliable internet receive urgent information?How can schools, tourism businesses and community leaders become part of the warning system?These may not look like traditional advertising briefs. But they are communication problems and communication is where our industry can contribute.Mountain communities must lead the conversation. Any meaningful response must begin by listening to the people who live in mountain regions. They possess generations of knowledge about their landscapes, rivers, weather patterns and local warning signs. They should not be treated only as vulnerable populations or passive recipients of outside solutions. They must be partners in designing these solutions. Technology should help strengthen local knowledges. Data may help anticipate danger but trust determines whether people act. Communication may create awareness but preparedness also requires infrastructure, resources and long term commitment. The most meaningful response will bring together community knowledge, climate science, public institutions, humanitarian experience, responsible brands, media reach, technological capability and creative thinking.A Global Call from Nepal:I appeal to creative professionals, industry associations, agency networks, brands, media platforms, technology companies, designers and storytellers around the world: Help us bring greater attention, ideas and collective action to the protection of mountain regions and their people.Let us begin asking difficult but necessary questions.How can climate information become understandable and actionable?How can warnings travel faster across remote difficult terrain?How can global technology work alongside local knowledge?How can brands support resilience beyond a single campaign cycle?How can our industry help ensure that vulnerable communities remain visible before - not only after disaster strikes?Behind every climate disaster is a community whose future depends on decisions being made today. Nepal needs your prayers and support. But Rasuwa and mountain communities around the world also need your attention, collaboration and ideas. Let this tragedy not become another moment the world mourns and then forgets. Let it become a moment when the global creative community chooses to listen, come together and act.Ujaya Shakya is First Vice President of Advertising Association of Nepal (AAN), Founder of Outreach and author of Brandsutra (2015) & Brandsutra 2.0 ABOUT AUTHORUjaya Shakya is a marketing genius, having written two volumes of BrandSutra, and has established Nepal's homegrown, much awarded integrated communication outfit, Outreach Nepal group. ...Read more

31 Aug 2026

Kolkata |31 August, 2026 India’s construction boom is creating a narrow window to cut emissions before new commercial and residential buildings lock in decades of energy demand. Green standards, low-carbon materials, efficient cooling and occupant wellness are becoming central to that transition. Summary India’s building sector is expanding rapidly, making construction and building operations an important part of the country’s decarbonisation challenge. Buildings already account for a significant share of India’s electricity demand, while much of the building stock that will exist in the coming decades is yet to be constructed. Green-building frameworks such as IGBC and GRIHA are pushing developers towards better energy, water, material and indoor-environment performance. BEE has also strengthened the policy framework through the Energy Conservation and Sustainable Building Code 2024 and Eco Niwas Samhita 2024. But certification alone cannot prove that a building is genuinely low-carbon. The bigger test is whether developers reduce embodied carbon in materials, improve HVAC performance, lower actual energy use and deliver measurable benefits for occupants after the building becomes operational. Keywordsgreen buildings India, net-zero buildings India, building decarbonisation, embodied carbon, construction carbon emissions, low-carbon construction, sustainable buildings, green building standards India, energy-efficient buildings, HVAC efficiency, green cement, recycled steel, building energy efficiency, occupant wellness, sustainable construction, building emissions, real estate decarbonisation, net-zero real estate, green construction India, building performance Can India’s real-estate boom become a decarbonisation opportunity instead of an emissions trap?India is entering a major phase of construction, with new offices, homes, hotels, hospitals and commercial developments expanding across its cities. Every building project makes decisions that can shape energy demand, cooling needs, material use and water consumption for decades. That creates both a challenge and an opportunity. A poorly designed building can lock in high energy consumption long after construction is complete. A well-designed one can reduce that demand from the outset through passive design, energy-efficient systems, lower-carbon materials and renewable energy. This is why the net-zero real-estate conversation is moving beyond visible measures such as solar panels and efficient lighting. The bigger question is how a building is designed, what materials go into it, how efficiently it operates and whether the people inside it actually experience healthier and more comfortable conditions. In other words, decarbonising real estate is not just about making buildings consume less electricity. It is about reducing their environmental footprint from construction and material choices through everyday operation and occupant wellbeing.   WHERE A BUILDING’S CARBON COMES FROM CONSTRUCTION Cement + steel + glass + transport↓ EMBODIED CARBON OPERATION Electricity + cooling + lighting + equipment↓ OPERATIONAL CARBON OCCUPANCY Thermal comfort + daylight + ventilation + indoor air quality↓ OCCUPANT WELLNESS NET-ZERO BUILDING Materials + energy + people + performance   Are green-building certifications enough to prove that a building is genuinely sustainable?India has developed two major voluntary green-building frameworks: the Indian Green Building Council (IGBC) and the GRIHA Council. Both assess buildings against a range of sustainability criteria, although their rating systems and approaches are not identical. IGBC offers rating systems for areas including new buildings, homes and net-zero buildings, while GRIHA evaluates factors such as energy and water use, materials, waste management, site planning and occupant-related performance. But certification should not be treated as simply a green label. It can demonstrate that a project has met a defined set of sustainability criteria. The harder test comes after the building is occupied.Does it perform as promised when it is put to real-world use?A developer may secure certification during the design or construction stage, but the building's real energy and resource performance becomes clearer only after it begins operating. Actual occupancy, cooling demand, equipment use and maintenance can all affect its performance. That makes the evidence behind the claim just as important as the certification itself. A credible assessment should establish the baseline, the performance target, the methodology used and the comparison point. It should also show how much energy the building actually consumes per square metre and whether that performance continues to be monitored after certification. This distinction becomes even more important for net-zero claims. A building may perform efficiently during operation, but its overall environmental footprint also depends on factors such as the materials used in construction and the emissions associated with producing and transporting them. Certification can show that a building meets a standard. Long-term performance data is what shows whether that standard translates into real-world sustainability.Can green cement and recycled steel cut the carbon hidden inside construction? Operational energy is only one part of a building’s carbon footprint. A building may use relatively little electricity once it is occupied and still carry significant emissions from the materials used to construct it. Those emissions are generated before the building is even ready for use, through activities such as mining, processing, manufacturing and transportation. This is why cement and steel are at the centre of the embodied-carbon debate. Developers and material manufacturers are increasingly exploring lower-carbon cement, alternative binders, recycled steel and more efficient use of construction materials to reduce emissions at this stage. But calling a material “green” is not enough. The real test is what changed compared with the conventional alternative. What material was replaced? What was its original carbon intensity? How much recycled content was actually used? Where was the material sourced from? What lifecycle boundary was used to calculate the reduction? And how much carbon was genuinely avoided? Without a clear baseline and reporting methodology, a percentage reduction can sound impressive while providing little information about its actual environmental impact. For a credible net-zero building claim, material-level emissions need to be traceable across the project's defined reporting boundary - from sourcing and manufacturing through construction and, where relevant, the building's future lifecycle. The goal is not simply to use greener materials. It is to prove how much carbon those choices actually prevent from entering the atmosphere.  THE EMBODIED-CARBON CHECKCONVENTIONAL MATERIAL Cement / steel↓BASELINE CARBON LOWER-CARBON MATERIAL Green cement / recycled steel↓ACTUAL CARBON ↓ MEASURED MATERIAL SAVING Baseline − Actual = Reduction Add: recycled content + source + lifecycle boundary + quantity used   Could HVAC design become the biggest operational test for green buildings?For India, cooling cannot be treated as an afterthought. As temperatures rise and air-conditioning becomes increasingly important across offices, homes, hospitals and commercial buildings, the way a building manages heat can have a major impact on both energy use and emissions. The Bureau of Energy Efficiency (BEE) building-efficiency framework covers areas including mechanical systems, HVAC, building envelopes, lighting, electrical systems and renewable energy. The Eco Niwas Samhita 2024 also focuses on residential building-envelope performance, with measures aimed at reducing heat gain while improving natural ventilation and daylighting. The logic is simple: a building that absorbs more heat needs more cooling, more cooling requires more electricity, and where electricity remains carbon-intensive, higher demand can mean higher operating emissions. That is why efficient HVAC systems cannot work in isolation. They need to be combined with insulation, shading, appropriate glazing, building orientation, ventilation and better envelope design. The more important question is therefore not simply: How efficient is the air-conditioner? It is: Why does the building need so much cooling in the first place?Building codes also play a crucial role. BEE's energy-efficiency standards provide a national framework, while state urban-development departments and local building authorities influence approvals, enforcement and implementation. MoHUA's urban-building policy framework and local development rules can further determine how sustainability requirements are translated into actual projects. This creates a potential implementation gap. A strong national standard can deliver limited results if compliance and enforcement remain weak at the city or project level.Does a green building still work if its occupants are uncomfortable?  This is where the human side of green construction becomes impossible to ignore. A building may report lower energy consumption while its occupants continue to experience excessive heat, poor ventilation, glare, noise or indoor-air-quality problems. Lower energy use alone therefore cannot determine whether a building is genuinely performing well. Occupant wellness needs to be treated as an outcome, not an optional feature added to a sustainability checklist. For offices, hotels, hospitals and residential buildings, relevant indicators can include: Thermal comfortIndoor air qualityDaylight accessVentilationAcoustic comfortOccupant satisfactionAccess to natural light and outdoor spaces The evidence should come from the people using the building as well as from its building-management systems. A developer's sustainability report can show energy consumption and technical performance. Occupant surveys can reveal whether those improvements actually translate into a building that is comfortable, healthy and functional for the people inside it. A building cannot be considered truly green if it saves energy on paper but compromises the people who have to live or work inside it. THE GREEN-BUILDING SCORECARD  AreaWhat should be measured?EnergykWh/m²/yearCarbonAbsolute + intensity emissionsMaterialsEmbodied carbonCementCarbon intensity + alternativesSteelRecycled content + lifecycle impactHVACEnergy performance + cooling demandWaterConsumption + reuseOccupantsComfort + air quality + satisfactionCertificationRating + post-occupancy performanceInvestmentBudget/capex + actual spendingContinuityPerformance after handover   Is India's building policy moving fast enough to match the construction boom?India already has a growing policy framework aimed at improving building efficiency and sustainability. The Energy Conservation and Sustainable Building Code 2024 and Eco Niwas Samhita 2024 provide updated approaches to energy performance and sustainable building design, while BEE also operates a voluntary star-rating programme for commercial buildings based on their actual energy performance. But a standard has value only when it moves from policy documents into real buildings. That means looking beyond whether developers have adopted a requirement on paper and examining whether it is followed through design, construction and everyday operation. State urban-development departments, municipal corporations and local building authorities also have an important role in approvals, development rules, implementation and enforcement, particularly where voluntary green-building standards overlap with mandatory regulations. The evidence should therefore separate five very different milestones: a target announced, a design approved, a certification obtained, a building completed and a building actually performing as promised. These milestones are not interchangeable, and treating them as one can make a project appear further ahead than it really is.What happens when green buildings cost more upfront? Cost remains one of the strongest arguments against more aggressive green-building requirements. Energy-efficient building envelopes, advanced HVAC systems, lower-carbon materials, smart controls and renewable-energy installations can all require greater upfront investment. That can encourage developers to prioritise measures with faster financial returns. But the calculation looks different when a building is assessed across its full operating life. Higher initial investment can potentially reduce electricity consumption, cooling requirements and maintenance costs over time. The better question is therefore not simply how much a green building costs to construct, but what environmental and financial outcomes that additional investment produces? A credible assessment should ask: How much additional capital expenditure was required? How much energy was saved? How much did annual operating costs fall? What was the payback period? And did the building continue to deliver those savings after handover? The money itself also needs to be traceable. A large sustainability commitment announced in an annual report is not the same as money actually spent on a completed project.Can India's developers move from green certification to genuine net-zero performance?Ultimately, the answer will depend on what the sector chooses to measure and disclose. The strongest projects will not stop at reporting the number of green-certified buildings. They will show baseline energy use, actual energy intensity, embodied-carbon calculations, renewable-energy generation, water consumption, occupant outcomes, capital expenditure and post-occupancy performance. The comparison point matters just as much. A claim that a building uses 30% less energy may sound significant, but 30% less than what? Was it compared with a conventional code-compliant building? An earlier version of the same project? Or a comparable building operating in the same climate? Without a credible baseline, even a large percentage reduction can be difficult to interpret. Net-zero performance is ultimately about measurable change, not simply the presence of a green label or the size of a sustainability claim.   ANNOUNCEMENT VS OUTCOME GREEN TARGET ANNOUNCED ↓ DESIGN ↓ CONSTRUCTION ↓ CERTIFICATION ↓ OCCUPANCY ↓ ACTUAL PERFORMANCE Energy ↓ | Carbon ↓ | Cooling demand ↓ | Water ↓ | Comfort ↑ The real green-building story begins after the ribbon-cutting.   So, can India's real estate sector decarbonise before the grid does?It can reduce a significant part of the demand it places on the grid. But “net-zero” requires more than efficient equipment or a green certification. It requires a clear boundary around emissions, credible assumptions, measurable reductions and transparency about renewable energy and any offset reliance. The first priority should be reducing demand. That means designing buildings that need less cooling, using efficient systems, reducing material emissions and improving water and resource efficiency. Renewable energy can then address part of the remaining electricity demand. Offsets, where used, should be clearly separated from actual emissions reductions. The strongest net-zero building is therefore not the one with the most impressive sustainability label. It is the one that can show what its baseline was, what changed, how much it cost, what occupants experienced and whether the performance continued after the project was completed. THE REAL NET-ZERO BUILDING TEST Build less carbon into the structure.Use less energy to operate it.Cool it intelligently.Measure what occupants experience.Follow the money.Report actual performance.Keep measuring after certification. India's construction boom is creating a narrow window. What gets built today will shape the country's energy demand for decades. The question is no longer whether India can build greener buildings. It is whether it can prove that those buildings stay green once people move in.   Sources:  Bureau of Energy Efficiency (BEE) — Energy Conservation and Sustainable Building Code 2024 (ECSBC 2024)Useful for: commercial/office building energy-efficiency requirements, building envelope, HVAC, lighting, electrical systems and sustainable-building provisions. BEE — ECSBC 2024 BEE — Eco-Niwas Samhita 2024Useful for: residential building energy performance, building-envelope requirements, heat gains, daylight and natural ventilation. BEE lists the 2024 ENS among its current building-efficiency resources. BEE — Eco-Niwas Samhita 2024 BEE — Building Energy Efficiency / Energy Efficiency ResourcesUseful for: India's building-sector energy-efficiency framework, commercial-building performance and retrofit/cooling resources. BEE — Building Energy Efficiency Resources Indian Green Building Council (IGBC) — Green New Buildings Rating SystemUseful for: IGBC certification, energy efficiency, water conservation, building materials, indoor environmental quality, certification levels and the transition to Version 4.0 from May 2026. IGBC — Green New Buildings IGBC — Net Zero Carbon RatingThis is especially important for your article. It supports the distinction between design/construction-stage and operations-stage certification, embodied-carbon requirements and operational-carbon requirements. It also states that the certification is valid for three years, reinforcing your argument that performance needs to be monitored rather than treated as a permanent achievement. IGBC — Net Zero Carbon Rating IGBC — Green Existing Buildings Rating SystemUseful for: operational performance, mandatory energy/water/fresh-air requirements, certification review and the importance of final documentation rather than relying only on anticipated performance. IGBC — Green Existing Buildings IGBC — Green Homes Rating SystemUseful for: the residential side of your story and current Green Homes Version 3.0 framework. IGBC — Green Homes ...Read more

31 Aug 2026

Summary Actively evolving Himalayas have spread their wrath once again, at present the World is gripped with the images of Glacial Lake Outburst Flood (GLOF) of Nepal, this year. Recent episodes of urbanization and developments in the name of mega infrastructure have disturbed Himalayas to such an extent that disasters have become much more frequent than ever. Keywords Himalayas, GLOF, Nepal flash flood The Kedarnath disaster of 2013 had popularized the term GLOF, acronym of Glacial Lake Outburst Flood. This year has witnessed another such episode in Nepal following the one at South Lhonak Lake of Sikkim in 2023. Glacial lake outburst flood (GLOF) takes place when ice blocks with huge number of rocks fall down in the glacial lakes supplying great amount of water and debris. The water holding capacity of the glacial lakes exceeds and after breaching the morainic embankment, water gushes out flooding the entire surrounding. By Dr Kanailal Das Fig 1: Glacial Lake Outburst Flood, a schematic diagram (Source: Antarcticglaciers.org)  An unimaginable disastrous flash flood flood took place in Nepal Tibet border on 26th August, 2026 at the confluence of Bhote Koshi and Trishuli rivers. Primarily it was established that a huge block of glacier collapsed and fell nearly 1000m downstream. This block of ice with englacial moraines (rocks within the glacier) instantly supplied enormous water and glacial debris. Generally, all glaciers have glacial lakes where glaciers start melting. Snow melt water beneath the glaciers is common in the high mountains. Thousands of glacial lakes beneath the glaciers are commonly found in Indian Himalayas. Fig 2: Locations affected by the flash flood (Source: NDTV Datafy)Nepal -Tibet border disaster has destroyed large number of bridges, roads, buildings and hydro power infrastructure. Rescue operations were very tough due to rugged terrain. The local community of the settlement was under the thick layer of mud and remnants of the collapsed infrastructure.     Course of events in Nepal disaster: High mountains - steep slopes - glacial melting due to warming - detached glacial block - huge amounts of debris and water supplied to glacial lake - breaching of the lake boundary - lake outburst - flow of water, mud and debris - settlement and infrastructure along the river swept away - bridges and road connectivity wiped away - death and missing humans and animals.   Fig 3: Pre and Post scenario of Nepal flood (The Economist, moneycontrolcom, abc news)  The disaster took place of August 26, 2026 occurred at the Gyirong - Rasuwagadhi gorge. It is the point where crossing roads via the Himalayas is possible between Nepal and China. The narrow place between two rivers is associated with hydro power infrastructure, heavily constructed zone of roads, custom facility and trade. The route across the location was being used by thousands of Mount Kailash pilgrims. Before 2011 the crossing was associated with very little infrastructure development with a rough road connectivity. The area experienced earthquake and landslides in the year 2015. A bridge was badly damaged. In 2017, the crossing was upgraded as an international dry port between Nepal and China. China also built a new bridge, 110 m Friendship Bridge beside the earthquake- damaged crossing site. The crossing and the dry port areas became an area of dense infrastructural development. Again, in July, 2025 a flash flood swept away the bridge. After that a temporary Bailey bridge had reopened the crossing. Number of missing people rises to 2,482, including 320 Indians, as Nepal disaster toll hits 584. Nepal accounted for 579 deaths and 1,924 missing and Tibet reported five death and 558 missing.  Rescue teams on both sides of the border were repeatedly forced to reassess and retreat Fryday as an unstable barrier lake overflowed into Bhote Koshi river, sent a fresh surge downstream and halted rescue. After a brief interval, another Avalanche dumped an estimated 50,000 cubic metres of ice debris. Satellite images showed post disaster formation of a great lake in the course of the river. 13 bridges along the river were swept away as the disastrous flood hit Rasuwa district of Nepal. Road connectivity was heavily destroyed. It took an arduous 50 hours after the mighty flash flood for the Chinese rescue teams to reach the core disaster zone around Gyirong dry port on Nepal - Tibet border using boats, ropes and heavily - lift drones. Thirty-seven tourists from West Bengal are missing in Nepal. A total of 39 persons of West Bengal were missing. Two of them have been rescued.    Fig 4: Satellite imagery showing aftermath of Nepal Flash Flood, 2026 (EU Space Program) Nepal is now monitoring the mountain glaciers near the glacier collapse zone. Satellite images show cracks in the glacier raising concern over fresh flash floods. Some information regarding the loss of life: The Times of india,28th August reported : No trace of 50 persons from Maharashtra and 37 from Tamilnadu. Among the Indians untraced in the Nepal Disaster 50 Kailash Manasa Sarovar yatris were from Maharashtra. At least 37 out of 57 pilgrims from Tamil Nadu and Puducherry are missing. Isha Sadhguru X Post :The whereabouts of 77 foreign nationals of Isha Foundation's Kailash Yatra, part of Isha Sacred Walks remained missing after the china immigration check post at Gyirong in Tibet was swallowed by the running water wall.  On August 27, 84 Indian nationals were rescued from Nepal including 63 workers at under - construction Trishuli 1 hydro power project. Around 200 Indian pilgrims on the Tibet side seek help for evacuation. Five groups of Indian pilgrims are missing till date. According to the latest reports the death toll from the Bhote Koshi -Trishuli disaster rose to 675 in Nepal on Saturday night, with 2,426 people still missing. Rescue teams are engaged in searching operations in glacial debris filled valleys, riverbanks and the tunnels of hydro power projects. Chinese authorities reported seven deaths and 554 people missing at Gyirong dry port on Saturday morning. Indian authorities revised down the number of Indian nationals unaccounted for in Nepal to 275 on Saturday evening, saying contact was reestablished with about 50 people. (Vishant Agarwala,The Times of india, August 30, 2026). According to the geologists the speed of Bhote Koshi river flow exceeded 55 km /hour in some stretches of the river. That is 15.3 m per second. A man cannot run so fast, most probably a man can run 3/4 m per second. In some parts of the river valley where there was no highland to take shelter men ran over the pathway along the river valley and got submerged within the swift disastrous flow of water and glacial debris. At the time of disaster there was no such heavy rainfall. The sky was almost fully clear. A shopkeeper of Trishuli market in Nuyakote said, “We were warned by the local authority to leave the market as soon as possible, we got a brief time to save us, but my family is lost." A bus carrying Manas Saravor pilgrims took a shelter in a comparatively high place, but some buses in front of us got no time and washed away in the surge with the pilgrims. Mallinath Kalkundi of Kanatataka told the reporter after the incident. However, danger lurks somewhere: The disaster is not over Satellite images indicate in the upstream there are two glacial lakes, one of the two lakes is full to the brim with huge amount of snow melt water. There is high probability of another glacial lake outburst flood in the same region. Glacial Lake Outburst Flood: Episodes from Indian Himalayas Thirteen glacial lakes in Uttarakhand in India are highly vulnerable for glacial lake outburst flood. In Indian Himalayas around 200 glacial lakes are recorded as unsafe and 25 of these lakes are considered of very high risk. The glacial Lake Outburst Flood, (GLOF) disaster in Nepal Wednesday, 26 August, 2026, has revived discussion on monitoring and management of the glacial lakes in Indian Himalayas. Himalayan ranges are the host of as many as 7,500 of them and 4,700 glacial lakes are situated in Ganga river basin with a catchment area over 2.5 lakh km2. One of the worst GLOF took place on October 3 midnight, 2023 producing 14.7 cubic metres glacial debris in the South Lhonak Lake in Sikkim. Several hydro power assets and settlements downstream were wiped out. This is a classic example of how a GLOF can transform a highaltitude glacial detachment into a major regional disaster.  Glacial block detachment - ice with englacial moraines - supply of water and glacial debris - water holding capacity of South Lhonak Lake exceeded - Lake Outburst took place -- huge amount of water and glacial debris supply to the Teesta water - hydro power infrastructure and part of settlement were wiped away - affected settlements downstream, causing loss of life and resources.   Fig 5: Pre and post South Lhonak Lake outburst (ICIMOD; Sattar et al., 2021) In June 2013 the famous Kedarnath Temple region and the settlements along the river Mandakini experienced rainfall induced glacial lake outburst flood.   Cloud burst, Extreme rainfall - rapid melting of snow and ice - landslides - debris supply to the lake behind Kedarnath Temple - Chora Bari Lake outburst - devastating flood around Kedarnath Temple and Mandakini river valley - Rambara settlement was completely destroyed.  Fig 6: Pre, syn and post flood situation, Kedarnath, 2013 (Bandyopadhyay and Kar, 2014) Other worst affected areas were Gaurikund, Sonprayag - Guptkashi, Agastyamuni and Rudraprayag. According to Government assessment 169 persons were dead and 4,021 people were reported missing. But local information indicated thousands of people were dead. The Kedarnath Disaster affected more than nine million people across Uttarakhand in various ways, including loss of homes, roads, bridges, communication and livelihoods. Rapid climate change causing glacial melting accentuates the genesis of GLOFs. As we tend to speeden up our so-called development in the name of smart cities and macro infrastructure the ensuing flood gups the whole settlement in seconds. Himalayas is still actively evolving, with unstable debris which is geologically very fragile and any unplanned construction without catering to the geology and climate is sure to invite apocalypse.  Response to Glacial Lake Outburst Floods: As a response to the Sikkim disaster National Disaster Management Authority, NDMA had set up a high-level coordination committee on GLOF disaster risk reduction. To take necessary steps to lessen the severity of the GLOF: Identifying the high mountains glacier - monitoring the change in the size of glaciers - Mapping the glacial lakes - monitoring the change in the volume of water in the glacial lakes - identifying the lakes at risk - initiative to stabilize the lakes at risk - controlled outflow of water if possible - establish an early warning system - evacuation of people - vulnerable zones of lake outburst flood, landslides should be avoided for settlement and infrastructure development. References: Bandyopadhyay S and Kar N.S. (2014): The Kedarnath Disaster: in search of scientific reasoning, Current Science, 107(4):557  https://www.icimod.org/press-release/new-scientific-study-confirms-climate-changeplayed-key-role-in-deadly-2023-lake-outburst-in-sikkim/ https://abcnews.com/International/deadly-nepal-flood-caused-enormous-landslideglacier-tumble/story?id=135984405 What caused Nepal flood? Scientist says it was enormous landslide, glacier fall https://eu-space.europa.eu/components/earth-observation-copernicus/image-of-theday/aftermath-nepal-flash-flood https://www.economist.com/science-and-technology/2026/08/27/the-terrifyingmechanics-of-the-nepali-flash-floodSattar A, Goswami A, Kulkarni A.V., Emmer A, Haritasya U.K., Allen S, Frey H and Huggel C (2021): Future Glacial Lake Outburst Flood (GLOF) hazard of the South Lhonak Lake, Sikkim Himalaya, Geomorphology, 388 (2021) 107783 https://doi.org/10.1016/j.geomorph.2021.107783 Vishant Agarwala, Tamaghna Bannerjee Chandrima Bannerjee, The Times of India, Saturday, August 29,2026.ABOUT AUTHOR  Dr Kanailal Das Masters in Geography from University of Calcutta, former senior research fellow, CSIR, PhD on Vulnerability of Gosaba, Basanti, Sundarban from Vidyasagar University.He has participated in many national and international seminars and has papers and book chapters to his credit.  ...Read more

30 Aug 2026

Nepal’s 2026 Himalayan flood was a climate warning, a planning failure and the first great test of a new government A mountain of ice and rock collapsed into a Himalayan headwater and sent a wall of debris through Nepal’s Bhote Koshi–Trishuli corridor. The calamity exposed a cruel climate injustice—and the deadly cost of concentrating homes, roads, hydropower and public institutions in a river’s path. Evidence cut-off: 30 August 2026. All casualty, missing-person, rescue and damage figures remain provisional and must be read with their stated cut-off. Summary: A disaster Nepal did not cause—but must now learn to surviveNepal is a low-emission, forest-rich nation living beneath a rapidly destabilising Himalayan cryosphere. The 26 August 2026 flood in Rasuwa appears not to have been a conventional glacial-lake outburst alone, but a cascade: a huge ice-and-rock mass fell into the Lhende valley, probably blocked a headwater temporarily, and released a violent debris flood into the Bhote Koshi and Trishuli systems. Climate warming loaded the background risk; narrow valleys accelerated the surge; and human settlement, hydropower concentration, fragile roads, riverbed disturbance and weak land-use enforcement multiplied the losses.At the evidence cut-off, Nepal had reported 675 confirmed deaths, 2,498 people missing or unaccounted for, more than 3,700 rescues and roughly 93,000 people affected. Damage to roads, bridges, schools, health facilities, border infrastructure and power projects has made this a national systems crisis, not merely a local flood. The new government’s mobilisation saved lives, but shortages of specialised equipment and resilient local command capacity were stark. The central lesson from both this flood and the 2015 earthquake is uncompromising: Nepal must not simply rebuild stronger structures; it must stop rebuilding critical exposure in places no ordinary structure can survive. Keywords: Nepal floods; Bhote Koshi; Trishuli; Rasuwa; Himalayan cryosphere; glacier collapse; glacial-lake outburst flood; climate adaptation; hydropower risk; managed retreat; disaster governance; resilient reconstruction; 2015 Gorkha earthquake; Himalayan Resilience Mission. Hashtags: #NepalFloods #HimalayanCrisis #ClimateJustice #BhoteKoshi #Trishuli #GLOF #DisasterResilience #BuildBackSafer #ManagedRetreat #HimalayanResilience The morning a mountain entered the river Nepal did not create the climate crisis now remaking the Himalaya. Through community forestry, it has raised forest cover to an officially estimated 46 per cent, while its carbon emissions per person remain a fraction of the global average. Yet at about 8:40 on the morning of 26 August 2026, the country became the downstream victim of a mountain system changing faster than its scientific surveillance, settlement planning and infrastructure could safely accommodate. A violent surge entered the Bhote Koshi river system in Rasuwa. This was not an ordinary monsoon flood, carrying only swollen water and silt. Ice, fractured rock, boulders, soil and pulverised debris rushed down together. Timure, Syabrubesi and nearby settlements were struck first. The flood then drove into the Trishuli and farther downstream, erasing roads, bridges, hydropower sites, markets, public offices, vehicles and homes within minutes. “Only my body survived.” — Kanchi Nepali, flood survivor That sentence captures the human scale of the calamity. It also points to its central public-policy truth. The initial mountain collapse may not have been preventable, but the scale of exposure was not inevitable. Nepal’s ecological values did not fail. Its risk maps, land-use discipline, warning reach, infrastructure standards, emergency equipment and institutional redundancy did. Not one GLOF, but a chain reaction Early reports described the event as a glacial-lake outburst flood, or GLOF. The term is understandable, because the final catastrophe behaved like a sudden high-mountain outburst. But the strongest preliminary evidence describes something more complex: a cascading failure of glacier, rock, slope, river and temporary natural dam. Satellite analysis indicated that a mass of glacier and supporting rock, roughly 600 metres wide, detached near the Langtang Lirung area at an elevation of about 5,200 metres. It fell approximately 1,200 metres into the Lhende valley. The United States Geological Survey initially detected what resembled an earthquake, then concluded that the collapse itself had generated a seismic signal equivalent to magnitude 5.2. The shaking was therefore an effect of the enormous fall, not evidence of a tectonic trigger. The mass transformed into an ice-rock avalanche. It struck or choked the Lhende Khola, a transboundary headwater running through the Nepal–Tibet border region, and appears to have created a short-lived natural dam. Water accumulated behind the obstruction; the blockage failed; and a high-speed slurry of water, ice, rock and sediment roared into the valley. Scientists are still testing the exact sequence, volume and time between blockage and breach. This distinction is not academic. A conventional GLOF programme watches known lakes. The Rasuwa disaster shows that a hanging glacier, collapsing bedrock, thawing permafrost or a temporary debris dam can produce a comparable or even more violent flood where no permanent lake has been classified as dangerous. Nepal must therefore graduate from lake monitoring to whole-mountain surveillance. The valley’s geometry amplified the force. The Himalaya is geologically young, fractured and steep. Rivers plunge through narrow gorges instead of dissipating across broad floodplains. Boulders make the flow behave less like water and more like wet concrete. A blocked channel stores energy; its failure releases a second shock. The mass deposited in one bend can redirect the river across ground that residents had long considered dry and safe. The event also defeated the assumptions of rainfall-based forecasting. A Nepali technical account reported that the Syabrubesi gauge stopped transmitting at 8:50 a.m.; the Flood Forecasting Division learned at 9:05 a.m. that a large surge had entered from Tibet and sent more than 600,000 SMS alerts at about 9:15–9:16 a.m. Those messages helped people farther downstream, but the upper corridor had almost no usable warning time. In a steep Himalayan basin, ten minutes may separate an evacuation from a mass casualty event. A green country beneath a warming “Third Pole” It is too early to claim global heating as the single, courtroom-proven trigger of this particular collapse. Scientists have not eliminated every immediate mechanism. It would, however, be equally misleading to treat the event as an isolated accident in an otherwise stable mountain system. Warming thins glaciers and changes the pressure they exert on supporting rock. Meltwater penetrates cracks. Freeze-thaw cycles shift. High-altitude permafrost—the frozen “glue” binding some mountain material—weakens. As glaciers retreat, steep rock faces can lose physical support. Rain falling at elevations where snow once accumulated adds liquid water and weight to slopes already approaching failure. The regional signal is unmistakable. ICIMOD reported that glacier loss across the Hindu Kush Himalaya accelerated by 65 per cent in the 2010s compared with the preceding decade. A 2026 assessment found that the region’s glacier area had contracted by 12 per cent between 1990 and 2020. The cryosphere is not merely shrinking. Its failure modes are changing, and yesterday’s hazard inventory is no longer an adequate guide to tomorrow’s disaster. Nepal thus faces a profound climate injustice. Nature-friendly practice reduces its contribution to planetary damage, but cannot shield Nepali valleys from heat accumulated largely elsewhere. The response must operate on two levels at once: much stronger adaptation and accountability at home, and a far more forceful international claim for grant-based adaptation, loss-and-damage support and shared Himalayan science. How a development corridor became a disaster corridor Human beings did not make the glacier fall. Human decisions did place more people, livelihoods and strategic assets directly in its path. Homes built where flat land—and safety—were scarce Mountain valleys offer little level ground. Homes, hotels, markets, schools, truck parks, customs facilities, roads and power projects naturally cluster on river terraces. Over two decades, the Bhote Koshi–Trishuli corridor became an economic spine connecting Kathmandu with Rasuwagadhi and Tibet. Concentration seemed efficient in ordinary times; during an extraordinary debris flood, it became concentrated exposure. This is why the housing debate cannot stop at whether a dwelling was made of mud, stone, brick or reinforced concrete. Traditional masonry and lightly engineered concrete are vulnerable to scour, saturation, lateral pressure and boulder impact. But no ordinary house can be designed to withstand a fast, multi-metre debris surge at close range. In the most dangerous corridor, safer construction does not mean a stronger wall. It means no permanent construction at all. The legacy of the 2015 earthquake deepened the vulnerability. CARE reported, on information from local partners, that hundreds of families displaced by that earthquake had resettled along low banks of the Trishuli, and that a community of about 250 households was swept away. The claim had not yet been independently incorporated into the government’s consolidated damage assessment at the evidence cut-off and must remain provisional. Even so, it raises a devastating question: did one recovery programme move vulnerable people into the path of the next hazard? Hydropower placed workers and national capacity in one line of fire Nepal’s hydropower strategy has located operating plants, construction camps, tunnel portals, substations, access roads and worker accommodation along confined river valleys. CARE’s initial assessment identified 14 hydropower and solar projects, with a combined capacity of about 748 MW, as affected. Reuters reported that the damaged power projects represented more than 12 per cent of Nepal’s national generating capacity. The flood was therefore both a humanitarian calamity and an energy-system shock. Hundreds of hydropower workers were listed as missing. More than 100 people were believed trapped in a mud-filled tunnel at the Upper Trishuli-1 site as rescue efforts entered their fourth day. The image of rescuers entering darkness with inadequate equipment distilled the cost of locating labour, machinery and strategic capacity in the same narrow zone of extreme risk. The deeper failure was cumulative assessment. A single plant can look acceptable when studied project by project. Fourteen energy projects, multiple worker camps, roads, bridges and substations in one basin can fail together. Environmental clearance must therefore consider the whole river system and the consequences of simultaneous breakdown—not only the footprint of each individual licence. Roads cut fast, slopes left fragile Nepal’s “excavator-led development” has often carved roads quickly into steep slopes without adequate drainage, retaining structures or safe spoil disposal. Unregulated crusher operations, riverbed extraction and dumping of excavated muck can raise or divert channels and destabilise banks. None of these activities caused the high-altitude collapse. They can, however, intensify local erosion, add debris, trigger secondary slides and destroy the access routes needed by rescuers. Development is not the enemy. Development that ignores geomorphology is. A road that collapses in every extreme event is not cheap infrastructure; it is deferred public loss. A bridge designed only for water level, and not for boulder-laden debris, is not resilient. Spoil dumped over a slope or into a channel is not disposal; it is material pre-positioned for the next flood. When local government itself became a casualty Federalism put municipalities and wards on the front line of disaster response. In Rasuwa and Nuwakot, municipal buildings, ward offices, public records, electricity and communications were lost, while elected representatives and employees were counted among the missing. The institutions expected to map needs, certify losses, release funds and organise shelter became victims of the same flood. This exposed a critical design flaw. Response authority was decentralised, but redundant communications, off-site data backups, mobile command posts and deployable engineering capacity were not decentralised with it. A local government cannot remain the first responder if the destruction of one building also destroys its records, radios and ability to act. The human ledger is vast—and still unfinished Every early disaster count is a moving target. Missing-person lists may contain duplicate names. People cut off by failed communications may later re-establish contact. Bodies and fragments carried far downstream complicate identification. Rescue figures issued by different agencies at different cut-offs cannot simply be added together. With those cautions, the strongest available snapshot by 30 August was nevertheless staggering. Nepal had recorded 675 confirmed deaths and 2,498 people missing or unaccounted for. The cross-border toll stood at 691 deaths, including 16 in Tibet, and 3,044 missing, including 546 in Tibet. The latest Associated Press account reported more than 3,700 people rescued in Nepal, while IFRC estimated that about 93,000 people had been affected. At least 17,000 children needed urgent assistance. These are not final figures; they are a minimum portrait of national grief. The physical damage is immense, but no reliable consolidated price existed at the cut-off. Early accounts identified about 40 kilometres of major road destroyed, at least 19 motorable bridges and dozens of suspension bridges lost, devastated customs and security infrastructure, hundreds of vehicles swept away and multiple energy projects damaged. Eighteen schools were destroyed and another 20 damaged, leaving an estimated 10,000 school-age children needing support to continue learning. Health authorities reported three health posts completely damaged, one hospital partly damaged and access to two hospitals disrupted. No trustworthy national total for homes lost was yet available. Nor should a financing estimate be confused with an audited loss assessment. Finance Minister Swarnim Wagle said Nepal might require US$4–5 billion to rebuild—close to one-tenth of the economy—while clearly warning that assessment work was continuing. “This is just an estimate. Loss and damage is being assessed.” — Finance Minister Swarnim Wagle That caution should govern all public communication. A disaster dashboard must distinguish confirmed from provisional figures; Nepal from the cross-border picture; people missing from people feared trapped; money pledged from money received; and financial need from verified physical loss. Balen Shah’s first trial by catastrophe Prime Minister Balendra “Balen” Shah took office on 27 March 2026 after the Rastriya Swatantra Party won 182 of 275 seats in the lower house. The mandate emerged from the 2025 Gen Z upheaval and rested on promises of competence, clean administration, jobs and a break with old patronage politics. Five months later, the Himalayan flood became the new government’s first existential test. The state moved quickly on several fronts. The Nepal Army, Armed Police Force, Nepal Police, national disaster authority, health emergency system, provincial and local administrations, helicopters, drones and medical services were mobilised. Downstream alerts were issued; relief centres opened; tracing support was provided to Nepali and foreign families; DNA evidence was preserved before unidentified bodies were buried; and rivers and newly formed barrier lakes were placed under observation. These actions saved thousands of lives. Helicopters bypassed broken roads. Warnings enabled evacuation downstream. By 29 August, more than NPR 5.44 billion and a further US$1.88 million had reportedly reached official relief accounts. The cabinet committed one month’s salary and began preparing a rehabilitation package. But the response also exposed the distance between digital aspiration and physical capacity. Agencies deployed dashboards, portals, GIS maps, drones and AI-supported data work, while field footage showed soldiers searching a dark, mud-filled hydropower tunnel with phone lights. Nepali reporting described shortages of heavy breaching equipment, satellite communications, payload drones and specialised tunnel-rescue machinery. Technology is not resilience if the data platform is modern but the rescue team lacks the tools to reach a trapped worker. The government initially restricted foreign search-and-rescue deployments, arguing that its own forces could manage and seeking to avoid the coordination congestion experienced after the 2015 earthquake. It later asked for defined specialist support in tunnel rescue, survivor detection, forensics and DNA, mortuary refrigeration, communications restoration and modular bridges. Moving from open-ended aid to a precise needs list was sensible; waiting during a narrow survival window nevertheless drew criticism. At the cut-off there was no evidence that the delay caused a specific death, and it should not be claimed otherwise. The world answered—but a pledge is not a result International support arrived from multiple directions. India delivered more than 57 tonnes of relief supplies and sent an 11-member tunnel-reconnaissance team. China provided tunnel specialists and emergency goods, while Japan supplied tents and blankets. South Korea deployed a response team and pledged US$1 million. The United Kingdom announced £5 million and a consular rapid-response team; Australia announced A$5 million; and the European Union allocated €2 million and activated satellite mapping. WHO sent medical supplies, UNICEF sought US$17.2 million, IFRC released nearly CHF1 million and launched a CHF25 million appeal, and the World Bank discussed possible emergency assistance of NPR 25 billion. This support expanded airlift, shelter, health, mapping and specialist capacity. Yet delivered goods, money deposited, expertise deployed, assistance offered, humanitarian appeals and loans under discussion are fundamentally different categories. Nepal should publish each separately. The world’s compassion will be measured not by the largest headline in the first week, but by what reaches bereaved families, displaced communities and damaged municipalities before the next monsoon. 2015 and 2026: two disasters, one unfinished lesson The 2015 Gorkha earthquake was broader and deadlier. Its magnitude-7.8 main shock and major aftershock killed 8,970 people, injured more than 22,000, affected about eight million and destroyed or badly damaged more than 755,000 homes. Physical damage was assessed at about US$7 billion, while recovery needs reached US$6.7 billion—roughly 30 per cent of GDP. The 2026 flood has so far killed fewer people, but its damage is intensely concentrated along a strategic, transboundary river corridor. It simultaneously struck energy, trade, tourism, transport, public administration and border connectivity. The earthquake produced aftershocks and landslides; this flood leaves unstable slopes, altered channels and possible barrier lakes capable of triggering new surges. The 2015 engineering lesson was to make structures resist shaking. The 2026 spatial lesson is to keep permanent settlement and critical systems away from extreme debris corridors and to design risk at basin scale. The contrast in relief is equally instructive. After the earthquake, a huge international influx strengthened medical and humanitarian response but strained logistics and coordination. In 2026, Nepal exerted greater national control and sought more selective foreign technical help. The right model lies between chaotic oversupply and defensive hesitation: sovereign coordination, a transparent needs list and immediate acceptance of capabilities that Nepal demonstrably lacks. Reconstruction after 2015 began badly. Political conflict delayed a functioning National Reconstruction Authority until 25 December 2015, eight months after the main shock. A border crisis restricted fuel and construction materials. Survivors endured monsoon and winter in temporary shelters while policy, beneficiary lists and housing grants stalled. The later record was considerably better. Nepal’s owner-driven model paid household grants in stages, connected disbursement to safer construction and added technical inspection and grievance systems. The national programme eventually produced more than 700,000 earthquake-resilient houses; a World Bank-supported component accounted for more than 300,000. Nearly all schools and public buildings were later reported rebuilt to improved standards, and rural housing recovery approached 95 per cent by the tenth anniversary, although urban disputes and exclusion persisted. The equity failure must not be forgotten. Landless people, tenants, low-caste families, single women, older persons and people with disabilities struggled disproportionately to prove eligibility, secure land or manage construction. The Asia Foundation documented the experience of a landless Dalit widow who remained in temporary housing for five years. National recovery averages can hide the people recovery leaves behind. Five lessons from 2015 therefore run through every decision in 2026. Stable coordination must be established before another construction season is lost. Households should lead their recovery, but must not be left to carry engineering risk alone. Tenants, informal occupants and landless families must be eligible from the beginning. International aid should be controlled through a public needs list. And Nepal must never rebuild only for the last hazard: an earthquake-resistant house placed in a debris-flow red zone is not a safe house. The next year: grief, pressure—and political judgment The social consequences will outlast the television images. Families must endure ambiguous loss while identification continues. Missing-person cases will create disputes over death certificates, compensation, inheritance and land. Displaced children risk losing months of schooling. Crowded shelters and disrupted livelihoods can increase risks of trafficking, exploitation and violence, particularly for women and children. If relocation sites separate people from farms, markets, schools, tourism and transport, economic necessity will drive many families back to the river. The economic impact will spread well beyond Rasuwa. Emergency expenditure and reconstruction will strain the national budget. Damaged hydropower may reduce electricity exports or force seasonal imports. Disruption on the Rasuwagadhi–Gyirong route will raise logistics costs, while trekking and pilgrimage cancellations will hit local income. Insurers and lenders may price hydropower and mountain infrastructure more cautiously. Yet a well-designed recovery can become a growth strategy. Demand will rise for resilient engineering, safer materials, satellite and GIS services, river restoration, distributed renewable energy, microgrids, tunnel safety and trained construction labour. If procurement is transparent and local, reconstruction can create jobs rather than merely import equipment and debt. Politically, the Shah government may emerge stronger if it publishes every rupee received, every contract awarded, every beneficiary selected and every milestone completed. If compensation becomes partisan, procurement opaque or relocation coercive, the same youth constituency that demanded political change in 2025 may turn against the new administration. No-construction zones will inevitably confront landowners, contractors, quarry operators, hydropower interests and political networks; the government will need law, evidence, compensation and public consent—not slogans alone. Diplomatically, disaster management will move to the centre of Nepal’s balancing relationship with China and India. China controls access to essential upstream territory and data. India is indispensable for downstream coordination, logistics, modular bridges, energy balancing and flood alerts. This calamity gives Kathmandu both the necessity and the moral authority to seek a standing trilateral Himalayan warning and response mechanism. Twenty actions for a safer Nepal Nepal should not reduce this recovery to a collection of replacement contracts. It needs a ten-year Himalayan Resilience Mission, backed by law and launched through a first-year compact that assigns duties to the state, citizens and the international community. What the Nepal government must do Create one public source of truth. The federal government should publish a reconciled, time-stamped dashboard for deaths, missing people, rescues, affected families, physical damage, aid received, funds spent, contracts and reconstruction progress. Categories and cut-off times must be explicit so that numbers cannot be inflated, added twice or manipulated politically.Give every missing person and family a legal pathway. A unified identification and tracing command should connect DNA collection, hospitals, mortuaries, police records and cross-border information. Fast legal procedures must address presumptive death, compensation, inheritance, guardianship and replacement of lost documents, while protecting families from fraud.Map the whole mountain, not only known lakes. Nepal should combine optical and radar satellites, InSAR slope monitoring, seismic and acoustic avalanche detection, high-altitude cameras, field geology and local observation to identify hanging glaciers, unstable rock faces, thawing permafrost, temporary dams and altered channels.Freeze unsafe rebuilding before concrete returns. A rapid red-amber-green zoning exercise should precede every permanent reconstruction approval. Red zones need an immediate construction moratorium; amber zones require site-specific engineering and evacuation plans; green zones should receive faster permits and infrastructure support.Use managed retreat, never forced eviction. Families leaving extreme-risk areas must receive replacement land with secure title, fair compensation for structures and livelihoods, rental support during transition, and relocation as functioning communities with schools, health care, markets, transport and cultural continuity. Tenants, informal occupants and landless people must qualify.Make local government disaster-proof. Every exposed municipality should have cloud-backed records, satellite communications, portable power, a mobile command post and access to regional equipment banks. Authority must travel with capability so that the destruction of a ward office does not paralyse relief.Put hydropower safety on a basin scale. All affected tunnels, headworks, substations, camps and access roads must be independently audited before reopening. Future approvals should require cumulative basin assessments, worker housing outside extreme floodways, tunnel refuges and escape routes, emergency power and communications, insurance and dedicated disaster reserves.Rewrite road, bridge and extraction rules for debris. New standards must consider boulder impact, scour and channel migration, with greater bridge clearance, replaceable spans, robust drainage, safe spoil sites, bioengineered slopes and independent material testing. Unscientific riverbed mining and dumping into valleys must be stopped and penalised.Automate warnings across every last mile. Redundant river gauges, sirens, radio, cell broadcast, satellite fallback and community messengers should be connected so verified thresholds can trigger downstream warnings without waiting for a slow chain of approvals. Schools, hotels, trekking routes, work camps and border posts need regular drills.Build an accountable recovery authority quickly. Nepal should avoid the eight-month institutional delay that followed the 2015 earthquake. A time-bound authority or empowered mission unit must include federal, provincial and local government, independent engineers, affected communities and civil society, with open procurement, grievance redress and public audits. What Nepal’s people, institutions and private sector must do Turn every exposed community into a warning network. Residents should map elderly people, children, persons with disabilities, safe routes, high ground, shelters and transport assets. Local volunteers need first-aid, search, radio and evacuation training, with women and young people in leadership rather than treated only as beneficiaries.Refuse the dangerous return to business as usual. Citizens, builders and local leaders must respect red zones and resist rebuilding on familiar but lethal river terraces. Community consent is essential, but consent must be informed by accessible hazard maps and paired with genuine land and livelihood alternatives.Make citizen science part of national science. Mountain residents, guides, hydropower workers, farmers and schools can report new cracks, unusual river colour, falling water levels, booming sounds, ice movement and blocked channels through verified local protocols. Their observations should feed—not replace—professional monitoring.Protect dignity and inclusion throughout relief. Community groups, media and civil society should monitor aid distribution, shelter safety and exclusion. Dalits, Indigenous communities, tenants, migrants, single women, older people and people with disabilities must be represented in beneficiary verification and relocation decisions.Convert reconstruction into a resilience workforce. Universities, technical institutes, businesses and municipalities should train young Nepalis as resilient masons, bridge technicians, GIS operators, drone pilots, glacier-monitoring assistants, tunnel rescuers, solar and microgrid technicians, community educators and bioengineering crews. Procurement should favour competent local firms, women-led enterprises and affected districts. What the world community must do with Nepal Send capabilities, not merely consignments. International partners should respond to Nepal’s published needs with specialised tunnel rescue, survivor detection, heavy breaching tools, payload drones, satellite communications, modular bridges, forensic support and mortuary capacity. Equipment must include training, maintenance and local ownership after the emergency.Finance adaptation as climate justice, not a debt trap. Donors, multilateral banks and climate funds should prioritise grants and deeply concessional finance, including Green Climate Fund and loss-and-damage resources. Nepal should ring-fence at least 20–25 per cent of reconstruction spending for risk reduction, supported by hydropower royalties, disaster insurance and a transparent diaspora resilience bond.Create a Nepal–China–India headwater protocol. The three countries should establish continuous upstream data exchange, common alert language, direct links among technical agencies and border posts, shared satellite imagery, automatic transboundary warnings and annual joint exercises. Rivers and glaciers cannot wait for diplomatic notes.Build an open Himalayan science commons. Space agencies, universities, ICIMOD, development partners and Nepali institutions should share high-resolution imagery, glacier inventories, slope data, models and field research in usable formats. Long-term funding must develop Nepali scientists and monitoring capacity instead of creating permanent dependence on foreign analysis.Stay for the decade, and measure outcomes. Humanitarian attention should not disappear when rescue ends. Partners must support safe housing, schools, health systems, energy diversification, microgrids, resilient tourism and watershed restoration through the next monsoons. Success should be judged by reduced exposure, restored livelihoods and lives protected—not by money pledged or kilometres rebuilt. Rebuild the nation, not the next disaster The 2015 earthquake taught Nepal how to construct walls that shake less. The 2026 flood must teach the country where not to build, how to watch an entire mountain, and how to protect power, roads, communications, government and communities when one valley fails. The wrong recovery would replace a washed-away bridge at the same height, rebuild a camp beside the same tunnel portal and move a landless family to the nearest available river terrace. It would count expenditure as achievement and convert reconstruction finance into the next catastrophe. The better recovery would create safer settlements, modern mountain science, a skilled resilience workforce, diversified energy, accountable government and a regional warning compact. Nepal cannot stabilise the global climate on its own. But with justice from abroad and courage at home, it can become the world’s leading laboratory for climate-resilient Himalayan development. Build back safer—and, where necessary, buildsomewhere else. ...Read more

29 Aug 2026

Kolkata| 29 August, 2026 India is looking to its coastline for a new sustainability opportunity, from mangrove restoration and blue carbon to seaweed farming and fisheries. But the real test is whether ocean-based growth can protect ecosystems and improve coastal livelihoods at the same time. Summary India's blue economy is expanding across conservation, fisheries, aquaculture and emerging ocean-based industries. The government is using MISHTI to restore mangroves, while seaweed cultivation and marine fish farming are being promoted as new blue-economy activities. India is also a major global fisheries producer, with the sector supporting millions of livelihoods. But measuring the climate value of coastal ecosystems remains more complicated than simply counting trees or calculating land-based carbon. For communities living along India's coastline, the transition is equally about income, access to resources, markets and benefit sharing. The real challenge is to ensure that blue-carbon projects and ocean-based businesses create measurable environmental gains without turning coastal communities into passive beneficiaries of a transition happening around them. KeywordsBlue Economy India, Blue Carbon, Mangrove Restoration, Coastal Livelihoods, Seaweed Farming, Sustainable Fisheries, Mariculture, Coastal Conservation, Ocean Economy, Marine Ecosystems, MISHTI, Sustainable Development Can India turn its coastline into its next sustainability frontier? India’s relationship with the ocean is economic before it is environmental. The country’s 11,099-km coastline supports fisheries, aquaculture, ports, tourism and millions of coastal livelihoods. The fisheries sector alone supports nearly 30 million livelihoods, according to NITI Aayog, while India accounts for around 8% of global fish production. Fish and fishery products generated about ₹60,523 crore in export earnings in FY2023–24. That makes the blue economy more than an environmental concept. It is equally a question of livelihoods, incomes, jobs and the future of coastal communities. At the same time, India’s coastline contains ecosystems with significant climate value. Mangroves, seagrasses, tidal wetlands and coastal sediments can store carbon while also helping protect coastal communities from erosion, storms and other hazards. This is where the idea of blue carbon enters the conversation. But India’s blue economy is much broader than carbon alone. It includes fisheries, aquaculture, seaweed, marine biotechnology, coastal tourism and ecosystem restoration, alongside emerging opportunities to create economic value from healthy marine ecosystems. The opportunity is substantial. So is the balancing act. A project can produce a strong sustainability headline without creating lasting benefits for the communities living along the coast. The challenge is ensuring that higher incomes do not come at the expense of the ecosystems that make those livelihoods possible. The real question, therefore, is not simply how much economic value India can generate from its coastline. But it is who creates that value, who benefits from it and whether the coastal ecosystem remains healthy enough to support those livelihoods in the long run. INDIA'S BLUE ECONOMY MANGROVES↓BLUE CARBON + COASTAL PROTECTION SEAWEED↓NEW LIVELIHOODS FISHERIES↓FOOD + INCOME MARICULTURE↓AQUACULTURE + ENTERPRISE TOURISM↓LOCAL ECONOMIC VALUE ↓ BLUE ECONOMYEconomic growth + ecosystem protection + coastal livelihoodsIs MISHTI turning mangrove restoration into a climate and livelihood strategy?Mangroves are at the heart of India’s blue-carbon conversation, but their value extends far beyond the carbon they store. They can help protect coastlines, support fisheries and provide livelihoods for communities living along the shore. The government launched MISHTI - Mangrove Initiative for Shoreline Habitats & Tangible Incomes - in June 2023 to promote mangrove restoration across India’s coastline. The programme’s original target covered approximately 540 sq km across nine coastal states and four Union Territories. By 2023–24 and 2024–25, the government reported that 26,396.34 hectares of degraded mangrove area had been brought under restoration through MISHTI, along with convergence with State CAMPA, MGNREGS and other schemes. A national MISHTI workshop held in January 2026 also placed emphasis on scientific restoration, climate resilience, livelihood generation and community participation. Planting mangroves is only the beginning; the real test is whether they survive, restore ecosystems and support the communities that depend on them. The more meaningful test is what happens after planting. How many hectares survive? Are the right species being restored in the right locations? What was the ecological condition before restoration? Has the project affected how local communities access fishing grounds, forests or other coastal resources? Who receives the livelihood benefits? And, critically, how much money was actually spent on restoration and community outcomes? India’s latest official assessment puts the country’s total mangrove cover at 4,991.68 sq km. West Bengal accounts for the largest share at 42.45%, followed by Gujarat at 23.66%. That makes both states particularly important to India’s blue-carbon story, but also places greater importance on ensuring that restoration is ecologically sound, locally relevant and capable of delivering benefits that extend beyond the project period.MISHTI: FROM PLANTING TO PROOFECOLOGICAL BASELINE↓SITE SELECTION↓COMMUNITY PARTICIPATION↓RESTORATION↓SURVIVAL MONITORING↓CARBON MEASUREMENT↓LIVELIHOOD BENEFITS↓ LONG-TERM OUTCOME The measure of restoration is not saplings planted. It is ecosystems that survive. Why is blue carbon harder to measure than carbon on land?This is one of the biggest challenges for India’s emerging blue economy. Carbon stored on land can often be measured within relatively defined boundaries, but coastal ecosystems are constantly changing. In blue-carbon systems, carbon can be stored not only in vegetation but also in coastal sediments. Tides, erosion, sediment movement, changes in land use and ecosystem degradation can all affect how much carbon remains stored and for how long. That makes a credible blue-carbon claim much more demanding than simply counting mangroves or measuring the area restored. A robust assessment needs to establish a clear baseline, identify the relevant carbon pools, define the geographical boundary and monitoring period, use a recognised methodology and assess how permanent the carbon storage is likely to be. India’s blue-economy investment framework identifies mangrove, coral and seagrass restoration and blue-carbon credits as potential investment opportunities, alongside activities such as seaweed farming and aquaculture. But this is where an important distinction needs to be maintained: An ecosystem can have significant environmental value even when its carbon benefit cannot yet be measured precisely enough - or converted into a tradable carbon credit. That means blue-carbon policy should not reduce the value of a mangrove, seagrass bed or coastal wetland to how many carbon credits it can generate. Their role in biodiversity, coastal protection, fisheries and local livelihoods also needs to be counted.THE BLUE-CARBON ACCOUNTING GAP COASTAL ECOSYSTEM Mangrove biomass+Sediment carbon+Ecological services ↓ MEASUREMENT Baseline+Carbon stock+Change over time+Permanence ↓ VERIFICATION Methodology+Monitoring+Audit trail ↓ CREDIBLE BLUE-CARBON CLAIM An ecosystem's carbon value is not automatically a carbon credit.   Can seaweed farming create a new income stream for coastal communities?Seaweed is emerging as one of the most visible livelihood opportunities in India’s blue-economy push. The government identifies the country’s 11,099-km coastline as having significant potential for seaweed cultivation, while research institutions including ICAR-CMFRI and CSIR-CSMCRI have identified 384 potential sites covering 24,707 hectares across coastal states and Union Territories. Government programmes are supporting activities such as rafts, monolines and tubenets, seed banks, hatcheries, training, research and market linkages. The Ministry of Earth Sciences has also identified seaweed farming, seed banks, tissue-culture laboratories, cluster farming, credit and insurance as potential areas for blue-economy investment. But potential is not the same as livelihood success. The stronger evidence would show how many people actually enter seaweed farming, how many continue beyond the first year, what farmers earn, who buys the harvest and how stable those prices are. It should also establish who owns the cultivation infrastructure and what happens when storms, disease or other environmental shocks damage a crop. Training women is only the first step. The real test is whether they stay involved, earn an income and have a say in how that income is used. Could mariculture reduce pressure on wild fisheries - or create new environmental risks? Mariculture and aquaculture can expand seafood production while creating new livelihood opportunities. The government is promoting marine fish farming alongside seaweed cultivation. In February 2026, it said India was developing both activities as part of its blue-economy strategy, including pilot-scale seaweed-farming studies along the Andaman coast. India has also entered into cooperation with Israel on fisheries and aquaculture, with an emphasis on technology-driven and sustainable practices and improving coastal livelihoods. But expanding marine farming brings another set of questions. Where does the feed come from? What happens to the waste? Which species are being farmed? Does the activity affect water quality? How much coastal space does it occupy? And does it restrict access for existing fishing communities? A project cannot be considered sustainable simply because its output comes from the sea. The full production chain and the ecological footprint it leaves behind must be accounted for.What do India’s fisheries numbers tell us about the people behind the blue economy?India is already a global fisheries powerhouse.NITI Aayog’s 2025 blue-economy strategy describes India as the world’s second-largest fish-producing country, accounting for around 8% of global fish production and supporting nearly 30 million livelihoods. The government is also using the Pradhan Mantri Matsya Sampada Yojana (PMMSY) to strengthen fisheries infrastructure and fisher welfare. The scheme has an investment framework of more than ₹20,000 crore and includes measures such as insurance and livelihood support for fishing communities. But national production figures can conceal what is happening at the household level. More fish production does not automatically mean higher fisher incomes. Higher seafood exports do not automatically translate into higher household earnings. And a larger fisheries economy does not necessarily mean better access to credit, insurance or social protection. That is why production data needs to be paired with household-level evidence. The real measure of a blue-economy livelihood programme is not simply how much seafood or seaweed it produces. It is whether coastal households earn more stable incomes, gain greater economic security and remain able to depend on the ecosystems that sustain them. DON'T STOP AT THE NATIONAL RANKINGFISH PRODUCTION ↑ does not automatically mean FISHER INCOME ↑ So, measure: Production+Prices+Household income+Employment+Insurance/social protection+Market access   BLUE-ECONOMY OUTCOME More ocean value + stronger coastal livelihoodsWhy do Gujarat, Tamil Nadu, Odisha and West Bengal matter to India’s blue-economy transition?India’s coastline is not a single ecological or economic zone. Different states face different combinations of fisheries, industry, ports, agriculture, tourism, coastal settlements and climate risks.Gujarat, for instance, combines major fisheries activity with extensive industrial and port infrastructure. Tamil Nadu has a large network of fishing communities alongside fisheries, aquaculture and dense coastal settlements. Odisha brings together vulnerable coastal ecosystems, fisheries, agriculture and industrial development. West Bengal presents a particularly distinctive case through the Sundarbans, where mangroves, fishing, agriculture and climate vulnerability intersect. That makes state-level implementation critical. A restoration or livelihood model that works in one coastal region may not deliver the same results elsewhere. Ecological conditions, community dependence, land-use patterns and economic opportunities can vary significantly from one coastline to another. The government’s blue-economy strategy itself identifies coastal states including Gujarat, Odisha and Tamil Nadu in discussions around fisheries development. The evidence should therefore move beyond national targets and examine what is actually happening in each coastal region - whether ecosystems are recovering, livelihoods are improving and communities are benefiting from the transition.   Can corporate investment protect the coast while delivering measurable returns? The blue economy is also opening a larger role for private capital. Companies connected to steel, infrastructure, mining, ports, agriculture and exports often have direct or indirect links with coastal ecosystems and communities. Their investments could support mangrove restoration, livelihood diversification, research, coastal resilience and more sustainable supply chains. But private investment needs the same level of scrutiny as public spending. A large corporate commitment does not mean the money has actually reached the ground. A CSR allocation does not automatically translate into an outcome. And hectares covered by a restoration programme do not tell us how many hectares actually survived. The evidence test should therefore follow the money from announcement to outcome: What was announced? What was budgeted? What was actually released? How much was spent? What was completed? Who benefited? And what continued after the funding cycle ended? The government’s PMMSY reporting offers a useful benchmark by distinguishing between funds approved and released and reporting both physical and financial progress. Private blue-economy projects should be held to the same standard. If the investment cannot be traced from the announced commitment to actual spending and measurable results, its sustainability value remains difficult to establish. Can India’s blue economy grow without pushing coastal communities aside?This is ultimately the social test of India’s blue-economy transition. Coastal communities are not simply beneficiaries waiting to receive the benefits of conservation or development projects. They already live and work within these ecosystems. Their livelihoods are closely tied to coastal waters, natural resources and the health of the ecosystems around them. That means community participation cannot be added at the end of a project. It has to be built into the design from the beginning. If mangrove restoration restricts access to fishing grounds without meaningful consultation or alternative livelihood support, an environmental intervention can create a real economic cost. If a blue-carbon project generates tradable credits while local communities receive little of the resulting revenue, a new carbon market could reproduce existing inequalities rather than correct them. A credible blue-economy model therefore needs transparent consent, tenure, access and benefit-sharing arrangements. It also needs grievance mechanisms that communities can actually access and use. Most importantly, the people affected by these projects should have a voice in measuring whether they worked. A sustainability claim should not rely entirely on project reports or management data. The strongest proof is on the ground: healthier ecosystems, stronger livelihoods and benefits reaching the communities that depend on them. What should India measure before calling a blue-economy project successful? THE BLUE-ECONOMY SCORECARD  Evidence testWhat to measureEcologyBaseline + habitat condition + survivalBlue carbonCarbon stock + methodology + permanenceLivelihoodsBeneficiary number + income changeWomenParticipation + income control + retentionFisheriesProduction + household income + market accessSeaweedFarmers retained + yield + actual earningsCommunity rightsConsent + tenure + access + benefit sharingCarbon creditsVerified credits + audit trailInvestmentBudget/capex + actual expenditureImplementationAnnounced vs operationalMonitoringMulti-year ecological + livelihood outcomesReportingBaseline + boundary + absolute/intensity results This changes the conversation. Instead of asking how much India is investing in the blue economy, it should ask what that investment is actually achieving. So, can the ocean become India’s next sustainability frontier?India’s coastline presents an enormous opportunity to build an economy around healthy ecosystems, resilient communities and sustainable use of marine resources. Mangroves can protect vulnerable coastlines while storing carbon. Seaweed can open new livelihood opportunities. Responsible aquaculture can expand seafood production. Fisheries can remain a major source of employment and income. And blue-economy investment can create new markets around conservation, restoration and ocean-based resources. But the transition comes with a crucial warning: India’s coastline cannot become the next sustainability frontier simply because it offers new carbon assets, investment opportunities and emerging markets. The people who already live and work along the coast must remain at the centre of the transition. The numbers alone do not tell the full story. Hectares restored, carbon stored and fish produced are only part of the picture.The real test is whether these efforts improved local incomes, protected access to resources, gave communities a meaningful say in decisions, shared benefits fairly and helped ecosystems remain healthy over time. Blue carbon must be measurable before it is monetised. Coastal livelihoods must be protected before they are transformed. And corporate investment must ultimately be judged not by the size of the announcement, but by the money that reaches the ground, the people who benefit and the outcomes that continue after the funding ends. Because India’s blue economy will be truly sustainable only when the value created by the ocean does not come at the cost of the people and ecosystems that depend on it. THE REAL BLUE-ECONOMY TESTProtect the ecosystem.Measure the carbon.Create viable livelihoods.Share the benefits.Track the outcome.Keep it working after the funding ends.Because India's next sustainability frontier cannot simply be blue. It has to be measurable, equitable and capable of surviving beyond the project cycle. Sources: Ministry of Earth Sciences, Government of India — Deep Ocean Mission [Source]Ministry of Earth Sciences, Government of India — Blue Economy Initiative [Source]Ministry of Earth Sciences, Government of India — Blue Economy Policy [Source]Ministry of Environment, Forest & Climate Change — Blue Carbon Ecosystems (Seagrass and Mangroves) of India [Source]Department of Fisheries, Government of India — Strategy for the Seaweed Development [Source]Department of Fisheries, Government of India — Seaweed Culture in India [Source]Department of Fisheries, Government of India — Seaweed Cultivation [Source]Department of Fisheries, Government of India — Pradhan Mantri Matsya Sampada Yojana (PMMSY) [Source]PMMSY — Climate-Resilient Coastal Fishing Villages [Source]PMMSY — Artificial Reefs and Coastal Fisheries Conservation [Source]  ...Read more

27 Aug 2026

Kolkata | 27 August, 2026  India is electrifying its railway network while metro systems are adding solar power, renewable procurement and energy-efficiency measures. But as passenger numbers rise, the next challenge is deeper: making the electricity, stations and first- and last-mile connections cleaner without confusing infrastructure announcements with actual emissions cuts. SummaryIndia's railway and metro systems are undergoing a major energy transition. Indian Railways had electrified 99.6% of its broad-gauge network by July 2026, while about 1,161 MW of solar and 103 MW of wind capacity had been commissioned by June 2026. Railway electrification has also sharply reduced diesel use for traction. Delhi Metro is increasing its renewable-energy use while passenger demand continues to grow. Kolkata Metro offers another lesson through energy-efficiency improvements alongside expanding ridership. The transition therefore cannot be judged only by kilometres electrified, solar capacity installed or green-station certifications. The stronger test is whether renewable electricity is actually being used, energy consumption per passenger falls, emissions decline within a clearly defined boundary and investments deliver measurable results. Keywordsrailway decarbonisation India, green railways India, railway electrification, Indian Railways electrification, railway renewable energy, railway solar power, railway wind energy, sustainable transport India, green transportation, railway energy efficiency, metro sustainability, railway emissions reduction, low-carbon transport, railway sustainability, railway renewable electricity, green railway stations, first and last mile connectivity, sustainable mobility, railway energy transition, clean transportation India Can India’s railway system go green as fast as it electrifies?  For decades, diesel locomotives were a visible part of India’s railway emissions story. Electrification has changed that equation dramatically. Indian Railways has pushed electrification at an exceptional pace. By July 2026, Indian Railways had electrified 99.6% of its broad-gauge network, with only a small portion yet to be electrified. Between 2014 and 2026, around 48,072 route kilometres were electrified, compared with roughly 21,801 kilometres during the six decades before 2014. The transition has also reduced diesel use for railway traction. Indian Railways reported that traction-related diesel consumption fell from 293 crore litres in 2015-16 to 108 crore litres in 2024 - 25.That represents a major operational shift. But electrification raises the next question: What powers the electricity? Switching from diesel to electric locomotives reduces direct emissions, but the overall climate benefit also depends on the source of the electricity used to power them. Electrification therefore removes one major source of direct emissions, but it does not automatically make the railway system renewable or zero-carbon.That makes renewable energy the next stage of the transition. Indian Railways reported that, as of June 2026, around 1,161 MW of solar capacity and 103 MW of wind capacity had been commissioned. The solar capacity includes both rooftop and land-based projects.The numbers show that the railway’s transition is moving beyond simply replacing diesel with electricity. The next challenge is to make more of that electricity cleaner - and to measure how much renewable power actually contributes to the railway’s overall energy demand and emissions reduction. THE ELECTRIC RAILWAY TEST  DIESEL TRACTION↓RAILWAY ELECTRIFICATION↓HIGHER ELECTRICITY DEMAND↓RENEWABLE POWER↓ACTUAL CLEAN ELECTRICITY USED↓LOWER EMISSIONS PER JOURNEY Electrification is the transition. Cleaning the electricity is the deeper decarbonisation test. Can railway stations become power producers instead of just power consumers?Railway stations offer a natural opportunity for solarisation. Their rooftops, parking areas and other available spaces can support solar installations, allowing electricity to be used at the station or integrated into wider railway operations. The scale of this effort has grown rapidly. In November 2025, Indian Railways reported 898 MW of commissioned solar capacity across 2,626 railway stations. Around 629 MW was intended for traction, while the remaining capacity supported non-traction requirements such as stations, workshops, service buildings and railway quarters.That figure, however, should now be treated as a milestone rather than the latest national total. By June 2026, Indian Railways reported around 1,161 MW of commissioned solar capacity.Installed capacity alone does not tell the full story. What matters is how much renewable electricity is actually generated and used. A stronger assessment would therefore ask:•    How much electricity is the solar capacity actually generating?•    How much is being used for railway operations?•    How much is supporting traction?•    When was each plant commissioned?•    What was the capital cost?•    What is its expected operating life?•    How is its performance being monitored?•    What happens to the equipment at the end of its useful life? A station covered in solar panels may look green. Renewable capacity is only part of the picture. A station that can demonstrate actual clean-energy generation, consumption and emissions avoided offers stronger evidence of meaningful decarbonisation. What happens when more passengers choose greener transport? This is where the story becomes more complicated. A public transport system can become more efficient even as its overall electricity consumption rises. Higher energy use does not necessarily mean that the system is becoming less efficient.If more people choose a metro instead of private vehicles, the system may consume more electricity overall while producing lower emissions per passenger journey. Delhi Metro provides a useful example. DMRC’s 2025 energy case study reported that solar power contributed 32% of its total energy consumption during the period assessed. The system has also used renewable electricity procurement to reduce its dependence on conventional power.Passenger demand has also grown, with Delhi Metro recording 235.8 crore passenger journeys in 2025 compared with 223.5 crore a year earlier. The figures highlight why electricity use needs to be assessed alongside passenger demand. If ridership grows faster than energy demand, the system may become more efficient. Even if total electricity consumption increases, a decline in energy use per passenger journey can indicate improved efficiency. But if both absolute electricity consumption and emissions continue to rise, a higher renewable-energy share alone does not tell the complete story. The real measure of a greener public transport system is therefore not simply how much renewable energy it uses, but whether it can move more people with a lower environmental cost per journey. ENERGY SAVINGS VS RIDERSHIP RENEWABLE SHARE ↑RIDERSHIP ↑ENERGY EFFICIENCY ↑↓CHECKTotal energy useEnergy per passengerCarbon per passengerAbsolute emissions A greener network should be measured against the people it moves, not only the infrastructure it installs. Can Kolkata Metro cut emissions by using less electricity in the first place?Kolkata Metro offers a different lesson in decarbonisation: sometimes the cleanest unit of electricity is the one the system does not need to consume.The transition does not always require a new renewable-energy plant. Improving the efficiency of existing infrastructure can also reduce energy use and emissions.Metro Railway Kolkata has been replacing its older steel third rail with a more conductive aluminium third-rail system. The railway has stated that the upgrade can reduce energy losses by 84% on the affected system, while also reducing voltage drops and improving operational efficiency. The project highlights a simple but important principle:Electricity generated from clean sources is still wasted if it is unnecessarily lost before reaching the system that needs it. That makes energy efficiency an important part of railway and metro decarbonisation. More efficient traction systems, regenerative braking, better station cooling, energy-efficient lighting and improved energy management can all complement renewable-energy procurement. Kolkata also demonstrates why ridership needs to be part of the climate discussion.After the Green Line became fully operational in August 2025, daily ridership rose from around 78,000 to 2.04 lakh.More passengers can naturally increase a metro system’s electricity demand. But that does not automatically mean its environmental performance is worsening. If those additional passengers are shifting from private cars, motorcycles or other more carbon-intensive modes, the wider transport system could still be reducing emissions. Can a Metro Be Truly Green If Passengers Still Depend on Cars to Reach It? A metro journey does not begin when a passenger enters the station.It begins at home.That makes first- and last-mile connectivity an important part of the decarbonisation story. A passenger who walks, cycles or uses an electric feeder to reach a metro station has a very different emissions profile from someone who drives a petrol or diesel vehicle to the station. A metro’s climate benefit does not depend only on the train journey. How passengers get to and from the station matters just as much. A low-carbon metro cannot be judged only by what happens on the tracks. The entire passenger journey has to be considered. That means the transition needs to connect: Homes → Feeder transport → Metro/Railway → Feeder transport → Destination Electric buses, e-rickshaws, shared mobility, cycling infrastructure and safe pedestrian routes can extend the climate benefits of mass transit beyond the station gates. This means metro corporations need to look beyond the electricity used to run their trains. The wider question is whether the transport network makes it easy for passengers to complete their entire journey through low-emission modes. The key question is:Are metro systems making it easier for people to reach and leave stations without having to fall back on high-emission private transport?A metro may run on clean electricity, but its full environmental benefit is limited if passengers still need petrol or diesel vehicles to complete the first and last mile. THE LOW-CARBON JOURNEY HOME↓🚶 WALK / CYCLEor⚡ ELECTRIC FEEDER↓🚇 METRO / RAILWAY↓🚶 WALK / CYCLEor⚡ ELECTRIC FEEDER↓DESTINATION The train can be green. The entire journey needs to move in the same direction. Does a green railway-station certificate prove that a station is sustainable? Not by itself.Green-building and green-station certifications can provide a useful framework for improving a station’s performance across areas such as energy efficiency, renewable energy, water conservation and waste management. The IGBC Green Railway Stations rating system, for example, covers several of these areas and can help guide stations towards more sustainable design and operations.But certification and actual environmental performance are not the same thing. A stronger evidence test should ask:What was the baseline? What did the reporting boundary include? Which measures were actually commissioned? How much energy is being saved? How much water is being conserved or reused? What was budgeted, and how much was actually spent? Are the claimed savings still being measured after implementation? These questions matter because a green rating can demonstrate that specific sustainability measures have been incorporated into a project. It does not automatically prove that the station is delivering the same level of long-term carbon reduction in its day-to-day operations. Ultimately, a certificate can show what a station was designed or assessed to achieve. Actual performance data shows what it is achieving in practice. Beyond Electrification: How Green Is the Railway? THE GREEN TRANSIT SCORECARD EvidenceWhat should be measuredElectrificationRoute kilometres + commissioning dateSolarInstalled MW + actual generationWindInstalled MW + actual generationTractionRenewable electricity actually usedStationsSolar coverage + electricity consumptionEfficiencyEnergy saved + energy intensityRidershipPassenger journeys + passenger-kmEmissionsAbsolute + intensity emissionsFirst/last mileEV and public-transport connectivityCertificationBaseline + reporting boundary + performanceInvestmentBudget/capex + money actually spentOffsetsQuantity, type and relianceLifecycleConstruction, equipment and end-of-life impacts This is where corporate and government reporting needs to become much more transparent. A company supplying renewable-energy infrastructure should clearly distinguish between capacity that has been announced, installed and actually commissioned. A railway authority should separate electricity generated from electricity actually consumed. A metro corporation should demonstrate whether renewable-energy procurement is translating into measurable changes in its emissions profile. Similarly, green-station certification should be treated as one part of the sustainability assessment, not a substitute for measuring the station’s wider emissions and resource use. The distinction may sound technical, but it determines whether sustainability claims reflect what is actually happening on the ground. Can the world’s largest passenger railway network decarbonise without compromising access? There is no single technology that can answer that question. Electrification is essential, but it is only the first layer of the transition. Solar and wind power can reduce the carbon intensity of railway electricity. More efficient traction systems can reduce energy losses. Greener stations can lower energy and water demand. Metro expansion can shift passengers away from private vehicles. Electric buses and feeders can connect neighbourhoods to mass transit while keeping the wider journey cleaner. Together, these measures can move the railway and public-transport system towards lower emissions without making access to mobility more difficult. But every layer creates a new measurement challenge.The sector needs to distinguish between announced and commissioned projects, installed capacity and actual generation, renewable-energy procurement and actual renewable-energy consumption, and energy savings and measurable emissions reductions. It also needs to account for the lifecycle footprint of new tracks, stations, trains, solar equipment and other infrastructure, rather than measuring only the emissions produced during day-to-day operations. The goal is not simply to build a railway that uses more clean technology. It is to build a transport system that can demonstrate, with evidence, that it is moving more people while reducing the environmental cost of that mobility. THE REAL DECARBONISATION TEST  ELECTRIFY↓POWER WITH RENEWABLES↓REDUCE ENERGY LOSSES↓GROW RIDERSHIP↓CONNECT FIRST & LAST MILE↓MEASURE EMISSIONS PER PASSENGER↓VERIFY SPENDING & PERFORMANCE  India’s Railways Are Going Electric. But Are They Truly Low-Carbon? The evidence points to a major transition - but not a finished one.Indian Railways has reached 99.6% broad-gauge electrification, while its latest reported renewable-energy capacity stood at 1,161 MW of solar and 103 MW of wind commissioned by June 2026. Traction-related diesel consumption has also fallen substantially over the past decade. These are significant milestones. But electrification is not the finish line. It is the foundation for the next stage of decarbonisation. The harder task now is to clean the electricity powering the network, reduce energy losses, expand public-transport use and make the entire passenger journey lower-carbon - from the first mile to the last. For Indian Railways and the country’s expanding metro systems, the strongest sustainability claim will therefore not simply be:“We electrified the railway.”It will be:“We can show how much cleaner each journey has become - where the electricity came from, how much energy and carbon were actually saved, what was spent and what changed on the ground.” That means moving beyond headline numbers and proving the difference between infrastructure installed and performance achieved. Because a railway does not become truly green simply because its locomotives run on electricity. Electrifying the railway is a major step. But it is not the finish line. The transition becomes truly green when the electricity gets cleaner, energy losses fall, more people choose mass transit, and emissions per journey show a measurable decline.That is what India’s green rail transition must ultimately prove: not simply that more tracks are electrified, but that every step is making the country’s mobility cleaner and lower-carbon.  Sources: Indian Railways / Ministry of Railways — Railway Electrification & Renewable Energy, July 2026Supports the latest 99.6% broad-gauge electrification, the 1,161 MW solar + 103 MW wind commissioned by June 2026, and the fall in traction diesel consumption from 293 crore litres in 2015-16 to 108 crore litres in 2024-25. Ministry of Railways — Railway Electrification & Renewable Energy Indian Green Building Council — Green Railway Stations Rating SystemSupports the sections on green-station certification, energy and water savings, renewable energy, waste management and first-/last-mile connectivity. It also explains the performance-improvement study and third-party assessment process. IGBC Green Railway Stations Rating System Indian Green Building Council — Green High Speed Rail Rating SystemUseful for the broader low-carbon rail infrastructure, lifecycle/site boundary and first-/last-mile connectivity discussion. IGBC Green High Speed Rail Rating System Indian Railways — Renewable Energy / Solarisation milestonesUse this for the earlier 898 MW solar capacity across 2,626 stations milestone that appears in the article as historical context. For the latest figure, use the July 2026 Ministry of Railways release above. Delhi Metro Rail Corporation — Sustainability / Energy documentationThis is the source to retain for the Delhi Metro solar contribution, renewable procurement, energy efficiency and ridership portions. The official DMRC site is also the appropriate primary source for its operational and sustainability documentation. Delhi Metro Rail Corporation ...Read more

27 Aug 2026

Introduction Along the muddy fringes of estuaries, salt pans, and mangrove edges across the world grows a modest, fleshy-leaved little plant that few passers-by would look at twice. Suaeda maritima, commonly called sea-blite, annual seablite or herbaceous seep weed, is exactly this kind of unassuming survivor. It thrives where almost nothing else can: in soils so saline that ordinary crops wilt and die within days. Yet this same salt-tolerance is what has made the plant valuable for thousands of years to coastal communities, who have eaten its tender shoots, used its ash and ground leaves as a savoury seasoning, and turned to its extracts for a surprising range of home remedies. In recent decades, modern phytochemical and pharmacological research has begun to catch up with this traditional wisdom, confirming that Suaeda maritima contains an unusually rich mixture of antioxidants, flavonoids, vitamins and minerals. At the same time, food scientists in several countries have started developing the plant into a commercial “green salt” or low-sodium seasoning powder, offering an alternative to ordinary table salt for people who need to watch their sodium intake. This article looks at the botany and characteristics of Suaeda maritima, reviews its herbal and medicinal benefits, explains how green salt is prepared from the plant and discusses why this preparation matters for human health. Salicornia sp.      Suaeda sp. Botanical Characteristics   Taxonomy and Names Suaeda maritima (L.) Dumort. belongs to the family Amaranthaceae, in the subfamily Suaedoideae, within the order Caryophyllales. It was formerly often classified in the older family Chenopodiaceae, which modern taxonomy now treats as part of Amaranthaceae. The plant carries a long list of regional common names, reflecting how widely it is recognised along coastlines: sea-blite, annual seablite, herbaceous seepweed and white sea-blite in English; and in parts of South Asia, names such as umari keerai in Tamil, referring to its use as a leafy pot-herb. Morphology Suaeda maritima is typically an annual herb, though some varieties behave as short-lived perennials in milder climates. It usually grows to a modest height of around 15 to 35 centimetres, occasionally reaching closer to a metre where conditions are especially favourable, forming low, spreading, much-branched clumps. Its most distinctive feature is its foliage: narrow, cylindrical to slightly flattened, fleshy leaves that store water and dilute the salt the plant absorbs from its surroundings. This succulence gives the leaves a glossy, almost waxy appearance, and the whole plant often takes on shades of yellow-green, blue-green, or, later in the season, reddish-purple as anthocyanin pigments build up under stress. The flowers are small, inconspicuous, and greenish, lacking showy petals; they are wind-pollinated and self-fertile, appearing from mid-summer into autumn depending on latitude. Seeds are tiny, dark, and glossy, and ripen a little after flowering. Because the plant completes its life cycle within a single growing season, it produces large numbers of seeds that can persist in the soil seed bank of salt marshes for later germination. Habitat and Distribution As a true halophyte, Suaeda maritima is specially adapted to grow in saline and even markedly alkaline soils, including tidal mudflats, salt marshes, the upper edges of mangrove stands, salt pans, and disturbed ground near salted roads. It prefers light, sandy, or loamy soils that stay consistently moist, and it cannot tolerate shade, so it is almost always found in open, sun-exposed coastal ground. The species has an extremely broad natural distribution, occurring along coastlines of Europe, Africa, Asia, and the Americas, which has made it a useful biological indicator of saline and alkaline soils in ecological surveys. Physiologically, the plant copes with high salinity through several linked strategies: succulence, which dilutes absorbed salts within enlarged leaf cells; selective ion transport, which channels excess sodium into vacuoles away from sensitive cell machinery; and the accumulation of compatible solutes such as glycine betaine, which help the plant maintain internal water balance under osmotic stress. Molecular studies on Suaeda species have identified numerous salt-responsive genes, reflecting just how finely tuned this plant is to its harsh environment. Phytochemical Composition Chemical analyses of Suaeda maritima have revealed a notably rich and varied composition. The plant contains dietary fibre, protein, carbohydrates, and a modest amount of fat, alongside a wide range of bioactive secondary metabolites, including alkaloids, glycosides, flavonoids, sterols, phenolic compounds, and tannins. Pigments such as beta-carotene contribute to its nutritional value, while its vitamin content is particularly striking: researchers have measured very high levels of vitamin E and appreciable vitamin C, both well above what is typically found in common leafy vegetables. The mineral profile is equally impressive. Suaeda leaves are reported to contain useful amounts of calcium, phosphorus, iron, copper, zinc, manganese, and selenium, in addition to the sodium and potassium one would expect from a salt-accumulating plant. Its amino acid profile includes all of the essential amino acids alongside a range of non-essential ones, and its lipid fraction is dominated by unsaturated fatty acids, with linoleic acid, an omega-6 polyunsaturated fat, making up the largest share. Studies using gas chromatography-mass spectrometry on seablite extracts have identified compounds such as phytol, myo-inositol, and several unsaturated fatty acid derivatives as major constituents, alongside substantial polysaccharide and flavonoid content in related Suaeda species. Herbal and Medicinal Benefits Suaeda maritima has a long history of use in traditional and folk medicine among coastal communities, and this has been progressively validated by laboratory research over the past two decades. The plant's pharmacological potential is generally attributed to its dense mixture of phenolics, flavonoids, tannins, and vitamins, which together give its extracts strong antioxidant capacity and a range of downstream biological effects. Pharmacological properties reported for Suaeda maritima extracts in published phytochemical and bioactivity studies.   Antioxidant Activity Extracts of Suaeda maritima consistently show the ability to neutralise free radicals, an effect closely tied to their high phenolic and flavonoid content. Root extracts in particular have shown strong radical-scavenging activity and the ability to inhibit lipid peroxidation, a process that damages cell membranes and is implicated in ageing and many chronic diseases. This antioxidant capacity underlies many of the plant's other reported benefits, since oxidative stress is a common thread linking inflammation, liver damage, and abnormal cell growth. Hepato-protective Effects Several studies describe hepato-protective activity in Suaeda sp. extracts, meaning they help defend liver tissue against damage from toxins or oxidative stress. This aligns with the traditional use of related seepweed species as a liver tonic in some folk medicine systems, and is thought to result from the combined antioxidant and anti-inflammatory action of the plant's phenolic compounds. Anticancer and Cytotoxic Properties Laboratory investigations into crude extracts of Suaeda sp., prepared at different polarities, have reported selective cytotoxic effects against cancer cell lines alongside antioxidant activity, suggesting the plant may hold promise as a source of natural anticancer leads. While such findings are encouraging, they come from cell-based and extract-level studies rather than human clinical trials, so they should be regarded as a foundation for further research rather than a proven treatment. Antidiabetic and Antibacterial Potential Suaeda maritima has also been investigated for antidiabetic properties, with some studies suggesting its extracts can help moderate blood sugar responses, complementing broader reports across the wider Suaeda genus of reduced blood cholesterol and lipid levels with regular consumption. Alongside this, antibacterial activity has been documented against a range of microorganisms, hinting at potential uses in natural preservation and topical antimicrobial applications. Skincare and Wound Healing A notable line of research from Thailand examined the root extract of Suaeda maritima specifically for skincare applications. That study found the extract to be rich in tannins and triterpenes, with substantial total phenolic and flavonoid content. In laboratory tests, the extract inhibited both free-radical activity and lipid peroxidation, and when applied to human skin fibroblast cultures, it increased cell proliferation and narrowed the gap in a simulated wound, indicating genuine wound-healing potential. This positions Suaeda maritima root extract as a promising ingredient for natural anti-ageing and skin-repair cosmetic formulations. Anti-inflammatory and Antiviral Reports Broader reviews of halophyte plants along the Black Sea coast, examining both Salicornia europaea and Suaeda maritima, describe additional biological activities including anti-inflammatory, antidepressant, antimicrobial, and antiviral effects, alongside the antioxidant, hepatoprotective, and anticancer properties already discussed. Together, these findings support the idea that halophytes such as Suaeda maritima are a promising, still under-explored source of bioactive compounds for functional foods, dietary supplements, and novel herbal preparations. Culinary Uses and Nutritional Role Long before scientists began analysing its phytochemistry, coastal communities were already eating Suaeda maritima as a leaf vegetable. Its young leaves and tender shoots have a naturally salty, slightly succulent flavour, and are traditionally eaten raw in small quantities within salads, or cooked and mixed with other vegetables to balance out the saltiness. In some regions, the young shoots are pickled in vinegar and served as a relish, while the seeds themselves are edible, raw or cooked, though less commonly used than the leaves and shoots. Because the plant absorbs and concentrates minerals from its saline habitat, it functions almost like a living seasoning: a small amount of chopped seablite can replace part of the added salt in a dish while also contributing fibre, vitamins and antioxidant compounds that ordinary refined salt cannot provide. This dual role, as both food and seasoning, is the traditional root from which the modern idea of “green salt” has grown. Green Salt: Preparation from Suaeda maritima “Green salt” is the name given to a low-sodium, mineral-rich seasoning powder made by drying and grinding the leaves (and sometimes the whole young shoots) of salt-accumulating plants. The best-known commercial green salt is made from Salicornia, a related succulent halophyte also known as glasswort or sea asparagus, but the same basic method applies to Suaeda and several food-science studies have specifically explored dried, powdered seablite as a partial substitute for ordinary salt in seasoning blends, marinades and even bread. One patented process describes producing a nutrient-rich herbal salt from halophytic plants of the Salicornia and Suaeda genera by growing them on saline soils, harvesting and solar-drying the biomass, and then charring and controlled incineration to concentrate the mineral content, though this industrial route is only one of several ways the plant can be processed. For household or small-scale artisanal preparation, the process is considerably simpler and closer to how other dried herbal seasonings are made. The steps below describe a typical leaf-powder method suited to home kitchens or small food enterprises. General workflow for preparing Suaeda maritima leaf-powder “green salt” at a household or small-batch scale. Step-by-Step Preparation Harvesting: Young, tender shoots and leaves are hand-picked from clean, unpolluted salt-marsh or coastal stands, ideally before flowering, when the leaves are most succulent and least fibrous. Washing: The harvested material is rinsed thoroughly in fresh water to remove mud, sand, loose surface salt crystals, and any debris picked up during harvesting. Drying: The washed leaves are spread thinly and dried, either under the sun, in a shaded, well-ventilated space, or in a low-temperature dehydrator or oven, until they become crisp and fully free of moisture. Careful drying preserves colour and nutrient content better than high-heat methods. Roasting or charring (optional): Some traditional preparations lightly roast or char the dried material in an open pan before grinding, which deepens the flavour, darkens the colour slightly, and can extend shelf life; this step is optional and varies by regional practice. Grinding: The fully dried leaves are ground, using a mill, blender, or traditional mortar and pestle, into a fine, even, deep-green powder. Sieving and packing: The ground powder is sieved to remove any coarse fibre or stem fragments, then packed into airtight, moisture-proof containers to protect it from humidity and preserve its colour and aroma. The resulting green salt is a fine, vividly coloured powder that carries a naturally salty, slightly earthy, umami-like flavour. Because it is made from the whole leaf rather than purified sodium chloride, it retains dietary fibre, plant pigments, vitamins, and the mineral spread naturally present in the plant, distinguishing it clearly from refined table salt both in composition and in taste. Health Significance and Benefits of Green Salt The growing interest in Suaeda-based and Salicornia-based green salts is closely tied to global concern about excessive dietary sodium. Ordinary table salt is almost entirely sodium chloride, and most guidance on healthy eating recommends keeping total sodium intake within a moderate daily limit, since habitually high intake is linked to elevated blood pressure and greater long-term cardiovascular risk. Green salt made from halophyte leaves offers a way to bring a genuinely salty taste to food while reducing the proportion of the seasoning that is pure sodium chloride, since a meaningful part of its weight is fibre, plant minerals, and other compounds rather than sodium alone. Beyond sodium reduction, several specific health-related points are worth highlighting. Lower relative sodium content: Because green salt is a whole-leaf powder rather than pure salt, gram for gram it typically delivers less sodium than table salt, helping people moderate intake without giving up a salty flavour entirely. Broader mineral profile: Alongside sodium and potassium, the powder carries calcium, magnesium, iron, zinc, and other trace minerals drawn from the plant's saline habitat, offering a more rounded mineral contribution than refined salt. Antioxidant and vitamin content: The retained flavonoids, phenolics, and vitamins C and E contribute antioxidant activity that ordinary salt cannot provide, aligning with the broader herbal benefits described earlier in this article. Dietary fibre: Because the whole leaf is dried and ground rather than extracted, green salt retains plant fibre, adding a nutritional dimension entirely absent from mineral salt. Reduced-sodium food product development: Food scientists have explored dried seablite powder as an ingredient in low-sodium fish marinades, seasoning blends, and even sodium-reduced bread, suggesting practical applications for people managing blood pressure or kidney-related dietary restrictions under medical guidance. It is worth noting that green salt is a seasoning and dietary supplement, not a medicine, and individuals with specific health conditions, particularly kidney disease or conditions requiring strict mineral or sodium control, should discuss any substantial dietary change, including switching seasoning types, with a qualified healthcare provider or dietitian before making adjustments. Ecological and Economic Significance Beyond its direct culinary and medicinal value, Suaeda maritima plays a meaningful ecological role. As a pioneer halophyte, it stabilises bare saline mudflats, helping other salt-marsh vegetation establish over time, and its dense stands provide shelter and forage habitat for invertebrates and shorebirds along many coastlines. Its reliable presence on saline and alkaline soils also makes it a useful bio-indicator, helping researchers and land managers assess soil salinity levels without needing extensive chemical testing. Economically, halophyte crops such as Suaeda and Salicornia are attracting growing interest as “saline agriculture” options: crops that can be cultivated using seawater or brackish water on coastal land unsuitable for conventional farming. This offers a route to generating income and food security in coastal and arid regions without competing for scarce fresh water, while simultaneously producing a genuinely novel, mineral-rich food and seasoning ingredient. Small-scale green salt production, in particular, has been highlighted as a way to create livelihoods for coastal communities, including women-led artisanal enterprises in some regions, while making productive use of land that would otherwise remain marginal. Conclusion Suaeda maritima is a striking example of how an unassuming coastal weed can turn out to be both botanically remarkable and practically valuable. Its succulent, salt-tolerant physiology allows it to thrive where few other plants can survive, and this same adaptation has given rise to a leaf chemistry unusually rich in antioxidants, vitamins, and minerals. Traditional use of the plant as a leafy vegetable and folk remedy is now supported by a growing body of research pointing to genuine antioxidant, hepatoprotective, antibacterial, antidiabetic, anticancer, and skin-healing properties. Its transformation into “green salt,” a dried, ground leaf powder used as a lower-sodium, mineral-rich seasoning, brings these benefits directly into the kitchen, offering a natural, plant-based alternative for people looking to season their food more mindfully. As interest in saline agriculture and functional, plant-derived foods continues to grow, Suaeda maritima seems likely to move further from the margins of the salt marsh into the modern pantry. Select References Sahu, B.B. & Shaw, B.P. (2009). Isolation, identification and expression analysis of salt-induced genes in Suaeda maritima. BMC Plant Biology. Peddi, P. et al. (2021). Green synthesis, characterization, antioxidant, antibacterial, and photocatalytic activity of Suaeda maritima aqueous extract-mediated copper oxide nanoparticles. Journal of Genetic Engineering and Biotechnology. Various authors (2022). Evaluation of cytotoxic and antioxidant activities of different polarities extracts of Suaeda maritima. Journal of King Saud University – Science. Various authors (2024/2025). Root of Seablite (Suaeda maritima), the Medicinal Halophyte for Skincare Application. PMC. Various authors (2024). Salicornia europaea L. and Suaeda maritima (L.) Dumort: bioactive compounds and future perspectives. Biotechnology & Biotechnological Equipment. Tongkam et al. GC-MS Analysis of Suaeda maritima and its Application as a Salt Substitute in Fish Marinade Powder. Indonesian Journal of Science and Technology. Preparation of Suaeda Tea Through Semi-Solid Fermentation. PMC. Preparation of nutrient rich salt of plant origin (patent document, halophytic Salicornia/Suaeda process). PFAF Plant Database and Wikipedia entries on Suaeda maritima (botanical characteristics and edible uses).  About Author  Siddhartha Chatterjee Dynamic professional with over 14 years of diverse experience spanning academic leadership, applied scientific research, government administration and rural development sector. Proven expertise in scientific research on observational oceanography and modelling, disaster risk management, coastal ecology, spearheading educational institutions, designing interdisciplinary course module, skill up-gradation of backward communities and organizing student-centric training programs in an unsupervised way. Adept in educational planning, handling time bound projects, effective utilization of human resource, need-based grooming/mentoring, overseeing administrative work and critical thinking. ...Read more

27 Aug 2026

Kolkata | 27 August, 2026   India’s higher-education campuses are becoming living laboratories for solar power, green buildings, waste reduction and water conservation, while their net-zero ambitions face a harder test from carbon-intensive grids, ageing infrastructure and rising student demand. SummaryIndian IITs, IIMs and universities are increasingly incorporating renewable energy, green buildings, energy-efficient infrastructure, waste management and water conservation into campus planning. Rooftop solar can reduce dependence on grid electricity, while retrofits can make hostels, classrooms and laboratories more efficient. Campuses can also reduce emissions through wastewater reuse, rainwater harvesting, waste segregation and better cooling systems. But a green campus is not automatically a low-carbon campus. A university must account for electricity purchased from, the grid, construction and renovation emissions, transport, water and waste systems, and the growing energy demand of laboratories, data infrastructure and air-conditioning. Students can add another layer of accountability by independently tracking whether sustainability promises translate into measurable outcomes. The real test is therefore not how many solar panels or recycling bins a campus installs, but whether its absolute emissions fall, its energy intensity improves, its investments deliver measurable outcomes and its sustainability systems continue after the initial funding cycle ends. Keywordsnet-zero universities India, green campuses India, university decarbonisation, sustainable campuses, campus sustainability, net-zero campus, green building in universities, rooftop solar universities, IIT net-zero campus, IIM sustainability, university carbon neutrality, campus carbon footprint, renewable energy in universities, sustainable higher education, green buildings India, campus waste management, campus water management, student sustainability audits, energy-efficient campuses, higher education sustainability Can a university really become greener while depending on a carbon-intensive grid?A university campus can look remarkably green from the outside. Solar panels may cover rooftops, new academic buildings may carry green-building certifications, waste may be segregated, rainwater may be harvested and students may cycle across campus instead of using cars. But these visible changes only tell part of the story.Where does the campus actually get its electricity from?Rooftop solar can reduce the amount of electricity a university buys from the grid, but most large campuses cannot rely entirely on solar power throughout the day or across every season. Laboratories, hostels, libraries, computer centres and air-conditioned classrooms can require a steady supply of electricity for long hours. This creates the central challenge of the green-campus transition. A university can reduce its dependence on grid electricity without becoming independent of it. The challenge becomes even greater as campuses expand. More cooling, digital infrastructure, research equipment and other energy-intensive facilities can push electricity demand higher, meaning that energy efficiency gains do not necessarily translate into lower overall emissions. The real test is therefore not how green a campus looks, but whether it is reducing its carbon footprint as its energy needs continue to grow. THE CAMPUS CARBON EQUATION Grid Electricity•    Campus Fuel•    Buildings & Construction•    Transport•    Water & Waste         ↓TOTAL CAMPUS FOOTPRINTSolar + Efficiency + Circular Systems          ↓EMISSIONS REDUCTION  The real test: Does the total footprint actually fall?   Are rooftop solar panels cutting emissions - or simply cutting electricity bills?Solar panels have become one of the most visible signs of a green campus. For universities, rooftop solar can deliver two benefits at the same time: lower electricity costs and lower emissions from grid power. But the number of panels installed does not, by itself, show environmental progress. A university can announce a large solar project and still rely heavily on grid electricity if the installed capacity is not fully operational or generation remains limited. The more meaningful questions are: How much solar capacity is actually operational? How much electricity does it generate each year? What share of the campus’s total electricity demand does it meet? How much grid power has it replaced? How much was invested? What is the expected payback period? And what will happen to the panels when they reach the end of their useful life? These questions become particularly important for IITs, IIMs and other institutions making carbon-neutrality or net-zero commitments. A megawatt of installed solar capacity is an activity. The electricity actually generated and the emissions demonstrably avoided are the outcomes that matter.Can old hostels become greener without rebuilding them? India’s university campuses also have a major opportunity in the buildings they already have. Many hostels, lecture halls, laboratories and administrative blocks were constructed decades ago, before energy efficiency became a central part of building design. Retrofitting these buildings can therefore deliver significant improvements without requiring complete reconstruction. Measures can include LED lighting, energy-efficient air-conditioning, building-management systems, insulation, improved windows, smart electricity controls, solar water heating, efficient pumps and better ventilation. Organisations such as IGBC and GRIHA Council have helped establish frameworks for improving the environmental performance of buildings. But achieving a green-building certification should not become the end goal. A building may receive a green rating because it meets specified design and construction requirements. How it actually performs once students, faculty and staff occupy it - is a separate question. For universities, the stronger test is simple: how much energy did the building consume before the retrofit, and how much does it consume afterwards? That comparison shows whether a green upgrade is delivering measurable energy savings rather than simply a greener label. THE GREEN-BUILDING TESTBEFORE RETROFIT Energy useWater useCooling demandMaintenance cost ↓ RETROFIT SolarEfficient coolingInsulationLightingSmart controls ↓ AFTER RETROFITEnergy saved?Water saved?Emissions reduced?Operating cost reduced? Certification shows design intent. Performance data shows what actually happened.   What happens to the waste and water a campus produces?Decarbonisation does not begin and end with electricity. A university campus functions much like a small city, with thousands of students, faculty members and staff using classrooms, hostels, laboratories, kitchens, cafeterias and other facilities every day. All of these activities create environmental pressures beyond energy use. Campuses generate solid waste, food waste, wastewater and other forms of resource demand that need to be managed alongside their carbon footprint. A campus cannot claim to be truly sustainable simply because its rooftops carry solar panels if its waste is poorly managed or its wastewater systems are inadequate. The green-campus question therefore extends beyond where electricity comes from to what happens to the resources and waste flowing through the campus every day. A serious green-campus strategy therefore needs to consider: Waste → segregation → recovery → recycling → residual disposal and Freshwater → consumption → wastewater → treatment → reuseRainwater harvesting can help reduce dependence on freshwater sources, while treated wastewater can be reused for landscaping, toilet flushing and other non-potable needs. Food waste can also be composted or sent through other recovery systems instead of being discarded. But the presence of rainwater tanks, composting units or wastewater-treatment plants does not, by itself, demonstrate environmental progress. Universities should report how much waste they generate, how much is recovered, how much is recycled or composted, and where the remaining waste ultimately goes. Water reporting should be equally transparent. Campuses should disclose freshwater withdrawals, total water consumption, the volume of wastewater treated and how much treated water is actually reused. These figures can give students, administrators and other stakeholders, a much clearer picture of how efficiently a campus uses resources - and where its environmental footprint still remains. Can students become the campus’s sustainability auditors?This could be one of the most valuable opportunities for higher education. Students do not have to remain passive beneficiaries of a greener campus; they can also become part of the system that monitors and questions its environmental performance. Engineering students can track electricity use and solar generation. Management students can examine sustainability budgets and spending. Architecture students can study how buildings perform after green upgrades. Public-health students can monitor indoor temperatures and heat exposure. Environmental studies students can track waste and water use, while journalism students can investigate whether a university’s sustainability claims match what is actually happening on campus. This approach can turn the university into a living laboratory, where sustainability is not just taught in classrooms but observed and tested in the institution itself. However, student participation should complement - not replace - professional auditing. Students can identify gaps, collect observations, analyse data and question institutional claims, while independent technical verification should remain in place wherever specialised assessment or certification is required. The goal is not to turn students into unpaid auditors. It is to give them a meaningful role in making the campus more transparent, measurable and accountable.  STUDENT SUSTAINABILITY AUDIT  ENERGY → Solar generation / grid dependence BUILDINGS → Energy intensity / cooling WATER → Freshwater / reuse WASTE → Generation / recovery / disposal TRANSPORT → Public transport / walking / cycling / EVs PROCUREMENT → Sustainable materials / suppliers ↓ STUDENT AUDIT REPORT Promise → Evidence → Gap → Recommendation   What happens when a green campus keeps expanding?There is another contradiction that net-zero plans need to confront: universities are growing, and growth itself has an environmental cost. New hostels, laboratories, classrooms and research facilities require concrete, steel, glass, cooling systems and other materials. A new green building may use less energy once it is occupied, but its construction still creates emissions and consumes resources. That means campus sustainability cannot be measured only through operational electricity use. Universities need to define a clear reporting boundary that captures the wider environmental impact of their activities. Does the footprint include new construction? Outsourced transport? Staff and student commuting? Purchased electricity? Refrigerants used in cooling systems? Or waste generated by contractors? If these sources are left outside the calculation, a university could report a smaller carbon footprint without addressing the emissions linked to its wider operations. A credible net-zero plan must therefore account for the emissions a university creates—not simply the emissions it chooses to count.Can corporate green-building partnerships create lasting change?  Corporate partnerships can play a useful role in campus decarbonisation. Companies such as Saint-Gobain, building-management firms, developers and other green-building partners can provide energy-efficient materials, cooling systems, building-management technology, solar solutions and retrofit expertise. But corporate involvement also needs to pass the same evidence test as the university’s sustainability claims. Was the intervention funded through CSR or delivered as a commercial project? Who paid for the capital investment? How much did the company contribute? What savings were expected? And who will maintain the system once the project is complete? These distinctions matter because installing a green technology is not the same as delivering a measurable and lasting reduction in emissions. Universities should therefore report the budget, actual expenditure, expected energy or emissions savings and the system’s actual performance after implementation. That makes it possible to distinguish between a partnership that simply delivers new infrastructure and one that produces a measurable environmental improvement.Can a campus measure sustainability without hiding behind percentages?This is where the evidence test becomes crucial. A reported “30% reduction in emissions” may sound impressive, but it does not tell the full story without context. Thirty per cent compared with what baseline? Over which period? Across which buildings? Was campus occupancy higher or lower? Did electricity demand change? Were construction emissions included? And was the reduction measured in absolute emissions or per student? Universities need to disclose their baseline, reporting boundary, methodology and measurement period alongside headline percentages. Absolute figures can show the scale of emissions, while intensity measures - such as emissions per student, per square metre or per unit of electricity consumed - can help compare campuses of different sizes. The same principle should apply to every major sustainability claim: solar generation, water savings, waste recovery, energy efficiency and carbon reductions should be backed by transparent data rather than isolated percentages. A green campus is not defined by the size of its sustainability claims. It is defined by whether those claims can be measured, compared and independently verified. THE GREEN CAMPUS SCORECARD  MeasureWhat should be reported?BeneficiariesStudents, faculty and staff actually coveredEnergyTotal consumption + energy intensitySolarInstalled capacity + actual generationBuildingsPre- and post-retrofit performanceWaterWithdrawal + consumption + reuseWasteTotal generated + recovered + final destinationCarbonAbsolute emissions + emissions intensityInvestmentBudgeted vs actually spentOutcomeActual reduction achievedContinuityWhat remains operational after funding ends A 20% reduction in energy intensity may sound like significant progress. But the more important question is: what happened to the university’s total electricity consumption? If a campus doubles its size while it’s energy use falls slightly per square metre, it’s overall electricity demand could still increase. That is why universities need to report both absolute and intensity-based results. Absolute figures show the total amount of energy or emissions being generated, while intensity measures show how efficiently that energy is being used relative to factors such as floor area or student population. The same principle applies to carbon emissions. Before claiming progress towards net zero, a university should clearly disclose its baseline, measurement methodology and reporting boundary. A lower percentage does not always mean a lower footprint. The numbers need context to show what has actually changed. So, what would a genuinely green campus actually look like?It would not necessarily be the campus with the most solar panels, the most green-building certificates or the longest list of sustainability initiatives. It would be a campus that can clearly account for its environmental footprint. It would know where its energy comes from, how much electricity it consumes, how its buildings perform, how much water it uses, where its waste goes and how its emissions are changing over time. It would consider lifecycle emissions when constructing new buildings instead of treating a green certification as the final measure of sustainability. It would also prioritise retrofitting older infrastructure where improvements can reduce energy and resource use, rather than focusing only on new construction. Water reuse and waste recovery would be measured through actual volumes and outcomes, not simply through the number of treatment plants, collection bins or recycling facilities installed. Students would have the opportunity to examine campus data, question sustainability claims and contribute to monitoring - while independent technical audits would provide verification where needed. And most importantly, sustainability would not depend on one CSR partnership, one university administration or one publicity campaign. A genuinely green campus is one where sustainable practice become part of how the institution operates - and continue to deliver measurable results even when the people, funding and projects behind them change. FROM GREEN CAMPUS TO NET-ZERO CAMPUS  MEASURE↓BASELINE↓REDUCE DEMAND↓RETROFIT BUILDINGS↓ADD RENEWABLE ENERGY↓CIRCULARISE WATER & WASTE↓VERIFY RESULTS↓ CONTINUE AFTER FUNDING   Can a university decarbonise faster than the grid?Yes. A university can reduce its own emissions faster than the wider electricity system changes—but it cannot simply disconnect itself from the grid. That is precisely where the opportunity lies. Universities can become living laboratories for decarbonisation: campuses where students, researchers, administrators and private partners can test technologies, measure results and learn what actually works in the real world. For CSR programmes and institutional sustainability plans, the defining question should therefore not be: “How many solar panels did the campus install?” It should be: “How much energy, water, waste and carbon did the campus actually reduce? How much did it cost? And is that improvement still delivering results?” A credible green campus should be able to show its baseline, account for its spending, disclose both absolute and intensity-based results, and explain what happens when a project or funding cycle ends. Because sustainability cannot be measured by appearances. A campus may have solar panels, green buildings, recycling bins and water-treatment systems and still struggle to reduce its overall footprint if its energy demand keeps rising or its wider emissions remain outside the reporting boundary. The real test is whether the entire campus moves towards lower resource use and lower emissions - and whether the evidence proves that progress. A university does not become sustainable simply when it looks green. It becomes sustainable when its buildings, electricity, water, waste and people move in the same direction - and the numbers can prove it. That is how a campus can become more than a demonstration of sustainability. It can become a model for how decarbonisation actually works.   Primary sources: IIT Delhi — Climate Action Plan & GHG Emission InventoryUseful for its Net Zero 2040 target, Scope 1/2/3 framework, renewable power, rooftop solar and campus sustainability measures. (IIT Delhi)IIT Delhi Climate Action PlanIIT Madras — Climate Action PlanUseful for the campus-wide climate strategy, carbon neutrality, academic buildings, hostels, laboratories, biodiversity and sustainability roadmap. (IIT Madras)IIT Madras Climate Action PlanIIT Madras — Carbon Footprint ReportParticularly important for your evidence-test section because it defines the campus boundary and explains Scope 1 and Scope 2 emissions, including purchased grid electricity. (sustainability.iitm.ac.in)IIT Madras Carbon Footprint ReportIIM Calcutta — Sustainability FrameworkThis is one of the most important sources for your article. It documents IIM Calcutta's Net Zero Campus 2036 target, carbon assessment, renewable expansion, emission reduction, energy/water/waste management and carbon audits. (IIM Calcutta)IIM Calcutta Sustainability FrameworkIIM Calcutta — Campus Transformation / Net-Zero Campus PlanUseful for the academic-block and hostel retrofit/construction angle, including its earlier plan for a Net Zero Energy, Net Zero Discharge and Net Zero Waste campus. (IIM Calcutta)IIM Calcutta Campus Transformation PlanIIT Bombay — Campus Sustainability AssessmentUseful for the campus-as-a-living-lab, sustainability assessment, resource management, student involvement and growing infrastructure-demand angle. (gesh.iitb.ac.in)IIT Bombay Campus Sustainability AssessmentIGBC — Green Campus Rating System, Version 1.0 (January 2026)Very important for your section questioning whether green certification equals actual performance. It explains documentation, third-party assessment, preliminary vs final submissions and implementation evidence required before certification. (IGBC)IGBC Green Campus Rating System 2026GRIHA Council — GRIHA for Existing BuildingsUseful for the green-building retrofit argument. It specifically discusses reducing energy and water demand in existing buildings and the importance of continuous performance monitoring. (GRIHA)GRIHA for Existing BuildingsGRIHA Council — Rated Projects 2025This gives you a concrete campus example: IIT Hyderabad's AD3 project reports a 51.25% reduction in energy performance index from the GRIHA base case, 3.5 MW solar PV, 73% reduction in building water demand and campus-level sewage-treatment infrastructure. (GRIHA)GRIHA Rated Projects 2025Bureau of Energy Efficiency — Energy Conservation Building Code (ECBC)Useful for the energy-efficient building and retrofit section. BEE's material specifically includes educational buildings such as colleges and universities within the building-energy-efficiency framework. (Bee India)BEE — Energy Conservation Building Code materialAssociation of Indian Universities — University NewsUseful for the broader higher-education sustainability framework, including sustainable buildings, reducing energy and water consumption, waste reduction, student/faculty engagement and industry/civil-society collaboration. (Association of Indian Universities)AIU University News — Sustainability in Higher Education ...Read more

25 Aug 2026

Kolkata | 25 August, 2026 India’s fashion industry is experimenting with textile recycling, cleaner production and circular retail models, but the real test is whether discarded clothes actually stay in the material loop - and whether companies can prove where they go. SummaryIndia generates about 70.73 lakh tonnes of textile waste every year, with around 58% coming from post-consumer disposal. At the same time, more than 70% of total textile waste is already being recovered through recycling, reuse, upcycling and downcycling, showing that India has an established recovery ecosystem rather than a complete absence of recycling. The bigger challenge is what happens to clothes after consumers stop wearing them. Garments can be reused, repaired, resold, downcycled or recycled, but blended and damaged textiles can be difficult to recover at their original value. Companies are responding through take-back programmes, recycled fibres, organic cotton sourcing, cleaner dyeing technologies and retail trade-ins. Yet a collection box or sustainability label does not automatically make fashion circular. The stronger test is whether companies can account for the material collected, show an audit trail for its destination, protect the workers handling discarded textiles and demonstrate measurable environmental gains against a clear baseline. Keywordstextile waste in India, circular fashion, textile recycling, sustainable fashion, textile waste management, fashion circular economy, textile circularity, post-consumer textile waste, textile waste recovery, textile recycling India, sustainable textiles, clothing waste, garment waste, textile upcycling, textile downcycling, recycled fibres, textile traceability, circular fashion supply chain, sustainable textile production, textile waste workers, informal waste workers, fashion sustainability, textile sustainability, circular textile economy, sustainable fashion India   What really happens to a T-shirt after we stop wearing it?For most of the consumers, a garment’s journey seems to end when it is placed in a donation bag, dropped into a collection box or thrown away. For the textile itself, however, that may be only the beginning.A discarded T-shirt can take several different paths. It may be worn again, repaired and resold, converted into wiping cloths or other products, or mechanically recycled into new fibres. But textiles that are heavily damaged, contaminated or made from difficult-to-separate blends can be much harder to recover and may ultimately end up as waste.This is where the idea of a circular fashion economy becomes more complex than simply collecting old clothes. India’s latest government mapping of the textile-waste value chain estimates that the country generates around 70.73 lakh tonnes of textile waste every year. About 42% is pre-consumer waste, generated during manufacturing, while the remaining 58% comes from post-consumer disposal. The study also estimates that more than 70% of total textile waste is already recovered through recycling, upcycling, downcycling or reuse. That changes the way the problem needs to be viewed. India is not starting from zero. A large share of textile waste is already finding its way back into the economy. The bigger challenge is what happens to the remaining material and whether textiles can be collected, sorted and recovered efficiently once they leave the formal manufacturing system. Collecting an old T-shirt does not, by itself, make fashion circular. True circularity begins when the garment has a clear path to its next use. FOLLOW THE FABRICConsumer discards garment↓Collection↓Sorting↓Reuse / Repair → Resale↓Recycling → New Fibre / Product↓Residual Waste → Documented Final Destination  The question: Does every kilogram collected have a documented destination? Can textile collection really make fashion circular?Post-consumer collection is becoming an increasingly visible part of sustainable-fashion efforts. Brands and retailers are encouraging consumers to return unwanted clothes through store collection points, take-back programmes and trade-in schemes. But collection numbers alone can give a misleading picture of circularity. Collecting 10 tonnes of used clothing may sound impressive, but the more important question is what happened to that material after collection.How much was reused? How much was recycled? How much was downcycled? How much was rejected? And where did the rejected material go? This is the difference between collection and actual material recovery.A credible circular-fashion programme therefore needs to maintain a clear mass balance - showing what entered the system, what was recovered, what was converted into another product and what ultimately remained as waste.India’s 2026 government assessment provides an important counterpoint. The country already has a substantial textile-recovery ecosystem, particularly for pre-consumer waste generated during manufacturing. High recovery rates in this segment show that parts of the domestic textile industry already have established systems for collecting and recovering material. The bigger challenge is what happens after a garment leaves the formal manufacturing system and enters the hands of consumers. That is where collection, sorting, logistics and end-market demand become critical to making post-consumer textiles genuinely circular. Is recycling always better than making new clothes?  Not necessarily. The environmental benefit of textile recycling depends on what material is being recycled, which technology is used and what the recovered fibre can replace. Cotton, polyester, nylon and blended fabrics behave differently during recycling. Mechanical recycling, for example, can shorten textile fibres and reduce the quality of the resulting material. More advanced recycling technologies may recover higher-quality fibres from difficult textiles, but they can also require greater investment, energy and specialised infrastructure. This creates an important competing view: Recycling is necessary, but recycling alone cannot solve the problem of overproduction and overconsumption. If brands continue producing large volumes of inexpensive clothing designed for short use, recycling systems may simply end up managing the waste created by a high-consumption model. That is why repair, reuse, resale and longer garment life need to be treated as equally important parts of the circular-fashion system. A garment that is worn for longer, repaired instead of replaced or resold to another consumer can delay the point at which recycling becomes necessary. The goal of circular fashion is therefore not simply to recycle more clothes. It is to keep garments and their materials in productive use for as long as possible. THE CIRCULARITY HIERARCHYLONGER USE↓REPAIR↓REUSE / RESALE↓RECYCLING↓DOWNCYCLING↓DISPOSALKeep the garment in use before breaking it back into material. Can fashion cut its water footprint before a garment even becomes waste?The environmental impact of clothing begins long before a garment reaches the end of its life. Processes such as dyeing and finishing during manufacturing can require significant amounts of water.This has led brands and technology companies to explore waterless and low-water dyeing technologies. Some emerging systems use alternatives such as supercritical carbon dioxide, while others use digital, foam-based or other processes designed to reduce conventional water consumption.The potential benefit is straightforward: using less water for the same production output can reduce pressure on freshwater resources while also lowering the volume of wastewater generated. But the technology still needs to pass an evidence test. A company should not simply state how many litres of water it saves per garment. It should explain what the saving is measured against and what the calculation includes.What exactly does the reported reduction cover? Is it limited to dyeing, or does it include finishing as well? Does the alternative process save water but consume more energy? Has it been proven at commercial scale? And how much has the company actually invested compared with what it originally announced? These questions matter because a technology can look highly efficient in a pilot project but deliver very different results when used across a large manufacturing operation. A water-saving technology becomes meaningful only when its environmental benefits can be demonstrated at commercial scale.Does organic cotton automatically make a garment sustainable?Organic cotton can be part of a lower-impact sourcing strategy, but the label alone cannot tell the complete sustainability story. What matters is how the cotton was produced, verified and traced through the supply chain. Companies need credible certification and traceability systems to establish whether suppliers are meeting the required environmental and production standards. There is also a crucial social question: Who is able to participate in this transition? Who are the farmers producing the cotton? What prices are they receiving? Can small producers afford certification? Who pays for compliance and verification? If sustainable sourcing requirements become too expensive or complicated, smaller farmers may find it harder to participate.Responsible sourcing therefore needs to look at both environmental performance and farmer inclusion. Certification can provide an important layer of verification, but it should be treated as a starting point for scrutiny rather than the final proof that a supply chain is sustainable.Can retail trade-ins actually make fashion more circular?Trade-in programmes are becoming another visible part of the circular-fashion model. Consumers return unwanted clothing to a retailer and receive a discount, store credit or another incentive towards a future purchase. The model can help solve one problem by giving retailers a way to bring used garments back into the system instead of allowing them to disappear into the waste stream. But there is also a potential contradiction. If a trade-in reward simply encourages consumers to buy another garment immediately, the programme could increase consumption rather than reduce it. A truly circular model would prioritise repair, resale and reuse for returned clothing, with recycling serving as the last option.The priority should be to keep the garment in use for as long as possible before breaking it down into fibre or treating it as waste.Who handles India’s discarded textiles?  India’s textile-recovery system cannot be understood without looking at the workers who already operate within it. Waste pickers, sorters, aggregators and small recycling units play an important role in collecting and recovering materials that formal systems may not reach. Yet much of this work remains invisible in corporate sustainability reporting. That raises an important CSR question: If companies want to build a circular fashion economy, what happens to the workers who are already recovering its materials? A responsible transition should consider fair wages, workplace safety, protective equipment, social-security access and stable incomes. Formalisation should not simply push informal workers out of the value chain. It should improve their working conditions, recognise their contribution and give them a more secure role in the circular economy. Organisations working with waste pickers and vulnerable communities, including Chintan and Goonj, can offer an important perspective on this issue. The worker’s voice matters because circularity cannot be considered fully sustainable if material recovery improves while the conditions of the people doing that work deteriorate.How can companies prove that their circularity claims are real?This is where the evidence test becomes the centre of the story. Saying that a company collected textiles, saved water, used organic cotton or launched a trade-in programme tells us what it did. The more important question is what difference those actions actually made.The more important question is what happened because of that activity.Companies should therefore disclose how much material was collected, how much was actually reused or recycled, what happened to rejected material, how much water was saved against a clear baseline, how much was invested and spent, who benefited and whether the programme continued after the initial funding or pilot period.The reporting boundary should also be clear. A garment collected is not necessarily a garment recycled. A garment recycled is not necessarily a garment returned to an equivalent use. And a sustainability claim is not meaningful unless the company can explain how the claimed benefit was calculated and what happened to the material afterwards. Circular fashion is ultimately not about making better claims about old clothes. It is about building a system in which materials, resources and livelihoods can be tracked from the beginning of the supply chain to what happens after the garment is no longer wanted. THE CIRCULAR FASHION EVIDENCE TEST  ClaimWhat should be proved?“We collected textiles”Total material collected and consumer/beneficiary denominator“We recycled them”Mass balance and material destination“We use recycled fibre”Fibre content and chain-of-custody evidence“We reduced water”Baseline, methodology and actual reduction“We use organic cotton”Certification and sourcing audit trail“We support waste workers”Wages, safety, income and benefit access“We invested in circularity”Budget versus actual expenditure“We reduced our footprint”Absolute and intensity results“Our programme is sustainable”Performance that continues over time This is the difference between a sustainability claim and a sustainability result. A percentage on its own does not tell the full story. Companies should clearly disclose what they measured, where they measured it, the period covered and how the improvement was calculated. A reported 30% reduction may sound significant, but the real questions are: 30% compared with what baseline? Across which facilities? Over what period? Did production increase or decrease? Was the saving measured in absolute terms or per garment? Without this context, sustainability figures can be difficult to verify or compare. Clear reporting boundaries and methodologies are therefore essential to show whether an environmental improvement represents a genuine change in performance. Can India turn textile waste into a resource without leaving its workers behind? India’s policy direction is also moving towards greater textile circularity. The Tex-Eco Initiative, announced in the Union Budget 2026–27, aims to promote globally competitive and environmentally sustainable textile and apparel manufacturing while helping the sector align with international sustainability standards and emerging green markets. Government efforts are also gradually focusing on textile-waste management, recycling technologies and value addition from discarded textiles.This creates an opportunity to move beyond isolated brand-led campaigns and build a wider circular textile system. But recycling cannot carry the entire burden. A genuinely circular apparel model would begin much earlier with durable products designed to last longer, followed by repair, reuse and resale before recycling becomes the final recovery option. That requires action across the entire value chain. Brands need to design garments that are easier to repair and recycle. Retailers need transparent take-back systems. Recyclers need reliable and traceable material flows. Governments need effective standards and enforcement. Consumers need clear information about garment durability, care and disposal. And there is one group that cannot be left out of this transition: the informal workers already collecting, sorting and recovering textile waste. They are not outside the circular economy. In many cases, they are already helping make it work. A truly sustainable textile system must therefore account not only for where the waste goes, but also who handles it, who earns from it and whether those livelihoods become safer and more secure as the system evolves.   THE REAL CIRCULAR-FASHION TESTDESIGN FOR LONGER USE↓REPAIR↓REUSE / RESALE↓COLLECT↓SORT↓RECYCLE↓TRACE THE MATERIAL↓MEASURE THE IMPACT   What should companies actually report?For CSR and corporate sustainability programmes, the most important question is not how many clothes were collected. It is what happened to those clothes afterwards, who handled them, who benefited and what environmental impact was actually avoided. A credible programme should report the total quantity of material collected, where it went and how much genuinely re-entered a productive material or product cycle. It should clearly distinguish between pre-consumer and post-consumer waste, disclose relevant certifications and audit trails, and explain how claims based on those certifications were verified. The people behind the system also need to be visible. When informal workers are involved in collecting, sorting or recycling textiles, companies should report their wages, working conditions, safety measures, access to social protection and how they are being brought into the formal circular economy. Financial reporting should be equally transparent: How much was budgeted? How much was actually spent? How much went towards collection, sorting, recycling, technology, worker protection and infrastructure? The reporting boundary must remain clear throughout. A kilogram collected is not automatically a kilogram recycled.A donated garment is not automatically a garment reused.A certified fibre is not automatically proof that the entire garment has a low environmental footprint.And a percentage reduction means little without a credible baseline and clearly defined methodology. Can fashion become circular without simply moving the waste problem somewhere else? That is the real test of India’s sustainable-fashion transition. India already has a significant textile-recovery ecosystem, with the latest government assessment indicating that more than 70% of textile waste is recovered through different pathways. But recovery alone does not equal circularity. The material still needs to be traced. Workers still need to be protected. Recycling processes still have their own environmental costs. Consumers still need to be encouraged to wear, repair, reuse and resell clothes for longer. And companies still need to demonstrate that their sustainability claims reflect what is actually happening on the ground. This is where the next phase of sustainable fashion will be decided. It will not be defined by how many collection bins a brand installs, how many take-back campaigns it runs or how many recycled garments appear in a catalogue. It will be defined by whether companies can follow a garment from the consumer’s wardrobe to its next useful life - and provide evidence for every major step along the way. Because a fashion system is not circular simply because it collects its waste. It becomes circular when materials stay in productive use, value reaches the people who make the system work, and environmental benefits can be measured and proven. That is the real standard India’s circular-fashion economy now needs to meet. Primary sources:  Ministry of Textiles — Mapping of Textile Waste Value Chain in India (2026)Covers the 70.73 lakh tonnes annual textile-waste estimate, 58% post-consumer / 42% pre-consumer split, recovery pathways, recycling technologies and post-consumer infrastructure gaps.Ministry of Textiles — Mapping of Textile Waste Value Chain in IndiaPress Information Bureau — Ministry of Textiles: Mapping of Textile Waste Value Chain in IndiaOfficial government release covering the report's headline findings, including 70.73 lakh tonnes of annual textile waste and more than 95% recovery of pre-consumer textile waste.PIB — Mapping of Textile Waste Value Chain in IndiaPress Information Bureau — Ministry of Textiles: Textile Recycling and Circular EconomyCovers the government's current textile-recycling and circular-economy initiatives, including the Tex-Eco Initiative.PIB — Textile Recycling and Circular EconomyPress Information Bureau — Ministry of Textiles: Innovative Textile Recycling TechnologiesCovers government support for textile-waste management, recycling, recycled fibres, new materials and value addition from discarded textiles under Tex-Eco.PIB — Innovative Textile Recycling TechnologiesPress Information Bureau — Environmentally Sustainable Production PracticesUseful for the article's cleaner-production, water/energy efficiency, hazardous-chemical reduction, organic textiles, natural dyeing and textile-waste management sections.PIB — Environmentally Sustainable Production PracticesCentral Pollution Control Board — Charter for Water Recycling and Pollution Prevention in Textile IndustriesPrimary regulatory material for the water-consumption, wastewater, chemical use and pollution-prevention angle.CPCB — Charter for Water Recycling and Pollution Prevention in Textile IndustriesPress Information Bureau — Textile Waste Innovation ChallengeDocuments the government's “What Is It Made Of?” Textile Waste Innovation Challenge and its focus on circularity, sustainable production and practical textile-waste solutions.PIB — Textile Waste Innovation ChallengePress Information Bureau — Union Budget 2026–27: Strengthening India's Textile Value ChainUseful for the wider policy context around Tex-Eco, sustainable manufacturing, textile modernisation and circularity.PIB — Union Budget 2026–27: Strengthening India's Textile Value ChainPress Information Bureau — Integrated Programme for the Textile SectorCovers the Budget's broader textile programme, including the Tex-Eco Initiative and sustainable textile manufacturing.PIB — Integrated Programme for the Textile SectorMinistry of Textiles — Textile Recovery Facility, Navi MumbaiParticularly useful for the newer collection, traceability and impact-measurement angle. In August 2026, the Ministry documented a proposed digital circular-textile infrastructure platform for collection, traceability and impact measurement.PIB — Textile Recovery Facility, Navi Mumbai ...Read more