
Total Articles 231+

Green Materials & Supply Chains

Focuses on eco-friendly materials and responsible sourcing to reduce environmental impact across the supply chain.

Showing 9

09 Oct 2026

9 October, 2026 | Kolkata Cotton is natural, familiar and widely used - but that does not automatically make every cotton shirt environmentally responsible. World Cotton Day highlights the need to look beyond sustainability labels and examine the water use, chemical management, farmer earnings, fabric quality and supply-chain transparency behind cotton clothing, especially when making festive purchases. SummaryIndia’s cotton industry supports farmers, textile workers and export businesses. But a shirt’s sustainability depends on more than its fibre label. Water availability, pesticide use, textile processing, durability, organic certification and the income farmers retain all matter. Following World Cotton Day on 7 October, the question is whether brands can prove their sustainability claims from the farm to the finished garment. If cotton is natural, what makes a cotton shirt sustainable? World Cotton Day, observed every year on 7 October, recognises cotton’s role in livelihoods, trade and the global textile industry. The 2026 observance highlighted the theme “Cotton for Good: Building Prosperity Through Trade, Transformation and Partnership”, placing economic opportunity and sustainability within the same conversation.  But the conversation should not end with celebrating cotton as a natural fibre. It should also ask how it is grown, how much water and how many chemicals are involved, whether farmers earn enough, and what happens when the fibre reaches textile factories. These questions matter when consumers begin buying clothes for Durga Puja, Deepawali and other festive occasions. A label may describe a shirt as cotton, organic or sustainably sourced, but each term tells us something different. None of them automatically proves that the entire garment has a low environmental footprint. The Food and Agriculture Organization (FAO) identifies cotton as an important source of income and employment for millions of smallholders and people across the textile value chain. Cotton also competes with fibres such as polyester, while manufacturers face pressure to control costs and meet buyers’ quality requirements. Sustainability therefore involves environmental protection, economic viability and the livelihoods of people who grow and process the crop.  The Hidden Water Cost of Your Cotton ShirtCotton is often criticised for its high water requirements, but its impact varies depending on where and how it is grown. Rain-fed cotton, irrigated cotton and cotton cultivated under different soil and weather conditions cannot be treated as though they have the same water footprint. A 2025 study of cotton production in central India examined water use, runoff and soil loss under rain-fed and drip-irrigated conditions between 2019 and 2022. The researchers reported that 51% of the average annual rainfall during the study period was lost through runoff. They estimated crop water use at 541 millimetres under rain-fed conditions and 624 millimetres under drip irrigation. The study also found that drip irrigation improved lint yield and reduced the calculated water footprint compared with the rain-fed system examined. These findings highlight why local conditions and the methods used to measure water consumption matter. However, they should not be treated as representative measurements for every cotton farm in Vidarbha. For this investigation, the reporting must trace the cotton back to where it was grown and establish whether the farm relied on rainfall, groundwater, canal water or another source. Farm records, irrigation details, local rainfall data and water-stress assessments can help provide this context. If a brand claims that its cotton uses less water, it should clearly explain the method, assessment boundary and comparison behind that claim. The investigation must also follow the material beyond the farm. Ginning separates cotton fibres from seeds, spinning turns the fibres into yarn, and weaving or knitting converts the yarn into fabric. Dyeing, washing and finishing can require additional water and chemicals. Therefore, lower water use during cultivation does not automatically mean that the finished shirt has a lower overall environmental footprint. Organic cotton: does certification tell the whole story? Organic certification can provide useful evidence about how cotton was grown under a defined standard. It helps buyers distinguish certified material from cotton for which an equivalent claim has not been demonstrated. India has a voluntary Standard for Chain of Custody for Indian Organic Fibres and Products, introduced under the National Programme for Organic Production. The system sets requirements for certified fibre, processing, handling and documentation, including transaction certificates for consignments moving through different processing units. It is designed to help maintain the integrity of organic material as it moves through the supply chain.  However, certification should not be treated as proof of every environmental benefit a brand might claim. A certificate does not automatically establish the water footprint of a finished shirt, the full chemical profile of its processing, its durability or the income received by the farmer. A 2025 systematic review of 20 cotton life-cycle assessment studies highlights why the distinction matters. The review found that organic cotton farming could have lower environmental impacts per unit of cultivated area, but higher impacts per unit of cotton mass in some comparisons, partly because organic systems may produce lower yields. The result depends on the measurement unit, farming conditions and impact being assessed. The review also identifies processing and consumer care, including washing and drying, as important parts of the wider lifecycle.  This does not mean organic cotton is inherently worse or that certification is unhelpful. It means that a single label cannot answer every question. Certification specialists may argue that standards and audits provide a practical foundation for accountability. Brands may point to certification as a way to manage complex supply chains. But maintaining records and separate material flows can involve costs, particularly for smaller suppliers. The reporting should examine what certification proves, what it leaves unmeasured and whether its requirements are practical for farmers and businesses. The key question is whether the claim on the garment is supported by the relevant records - and whether the brand explains the limits of that claim. Pesticides and farmer income: who bears the cost of cotton? Cotton farmers must manage pests, weeds, unpredictable weather and production costs. Their decisions are shaped by available advice, labour, seeds, inputs and reliable buyers. Reporting on pesticide use must recognise these pressures rather than treating farmers as the sole cause of environmental harm. Pesticide use can create risks for farm workers, nearby communities, soil and water when products are applied or handled improperly. Yet pesticide runoff at a particular location must be established through appropriate sampling and testing, not inferred from the mere presence of cotton cultivation. Research offers evidence that alternative approaches can be worth examining. A field study conducted during the 2022–2024 rainy seasons in Khandwa district, Madhya Pradesh, evaluated integrated pest management in Bt cotton. It reported a 46.55% reduction in pesticide sprays, a 25.38% increase in seed-cotton yield and net returns more than 56% higher than under the farmers’ usual practices. The findings support further investigation of integrated pest management, but they do not establish that the same outcomes have already been achieved across Vidarbha.  For farmers, however, the question is not simply whether a method is environmentally preferable. It must also be practical and financially viable. An alternative may require new equipment, training, additional labour or different timing. Farmers need to know whether the expected benefits outweigh those costs and whether buyers will reward the effort. This is why farmer net returns deserve particular attention. A higher selling price does not necessarily mean a higher profit. Seed, fertiliser, pesticide, irrigation, labour, transport, interest and other costs affect what remains after harvest. The investigation should compare production costs with sale receipts and, where possible, payments under procurement arrangements. It should ask whether certified cotton earns a premium, whether that premium reaches the farmer after intermediary costs, and whether growers face additional expenses to meet sourcing requirements. A brand may describe its sourcing as responsible, but the claim means little economically if the farmer cannot demonstrate a fair or reliable return. Equally, a sourcing programme should not be dismissed simply because it has documentation costs. The relevant question is whether the arrangement provides verifiable environmental and livelihood benefits, and who bears the cost of achieving them. From Vidarbha to the export house Cotton may pass through several businesses before it becomes a shirt. It can be sold to a ginner, processed into fibre, spun into yarn, woven or knitted into fabric, dyed and finished, cut and stitched into a garment, and then supplied to a retailer or export house. At each stage, material may be combined, processed or transferred to another operator. This makes chain-of-custody evidence central to claims that a garment contains cotton from a particular farm, region or certified source. India’s Kasturi Cotton Bharat programme is one example of an effort to strengthen traceability and certification. A Ministry of Textiles backgrounder reported that, as of 30 June 2026, 3,29,550 bales had been certified under the programme and 116 units had renewed registration. The initiative describes QR-based certification and blockchain technology as part of its traceability approach. These figures show activity within the programme; they do not prove that any particular retail shirt contains cotton from a named farm. Product-level claims require product-level evidence.  For this story, the evidence trail should connect the farm or producer group to the ginner, spinner, fabric maker, processor, garment manufacturer and exporter. Purchase orders, invoices, batch identifiers, processing records, certification documents and transaction records can help establish whether the material remained traceable through these stages. It is also important to distinguish physical traceability from systems that reconcile certified inputs and outputs through records. A company must explain which system it uses and what that system proves. A certificate may establish compliance with a particular standard, but it should not be presented as proof of every environmental or social benefit. Different stakeholders may judge the same sourcing system differently. Exporters may prioritise consistent quality, timely delivery and competitive pricing. Weavers may focus on yarn quality, fabric performance and reliable supply. Farmers may be concerned with crop risks, production costs and the price received. Certification specialists may emphasise standards, documentation and auditability. These priorities can overlap, but they can also conflict. Stronger traceability may improve accountability while increasing administrative costs. A sustainability premium may help farmers, but only if it is passed through transparently. A certified material may satisfy a buyer’s sourcing requirements without establishing that every stage of processing has a lower environmental impact. The reporting should test these competing perspectives against documents and evidence rather than assuming that either a certificate or a criticism settles the question. Blends, Durability and the Clothes We Keep The fibre content of a shirt is another important part of its sustainability profile. A garment marketed as cotton may contain a blend of different fibres, making its exact composition important. Blended fabrics can offer practical benefits, including stretch, better shape retention and reduced creasing. However, their environmental impact depends on the materials used, how the garment is constructed, how long it lasts, how it must be cared for and what options are available when it reaches the end of its useful life. Cotton is not automatically the best choice for every purpose, just as a synthetic blend is not automatically the worst. A meaningful comparison must consider what the garment is designed to do, how long it is likely to last, how frequently it will be worn and what happens when it is no longer usable. Durability deserves greater attention during festive shopping. A shirt that is worn repeatedly and repaired when needed may offer better value than one that loses its shape, tears or is discarded after only a few uses. However, durability claims should also be examined rather than accepted at face value. Fabric specifications, seam strength, shrinkage, colourfastness, care instructions and repair options can all help indicate how well a garment is likely to last. The same scrutiny should apply to claims about recycled content or easy recyclability. A fabric’s composition can determine how easily its fibres can be separated and recovered. Consumers should not assume that a blended garment can be recycled simply because one of its materials is recyclable on its own. The wider life cycle matters too. A garment’s environmental footprint extends beyond cotton cultivation. Processing, manufacturing, transport, washing, drying, repair and disposal all contribute to its overall impact. A 2025 systematic review of cotton life-cycle assessments highlights the importance of examining these stages together rather than judging sustainability by the raw material alone. What Should Shoppers Ask Before Buying Festive Clothes? Consumers cannot inspect an entire supply chain while shopping, but they can ask more informed questions: What is the exact fibre composition? Check whether the garment is made from pure cotton or a blend of different fibres.Is the organic or sustainability claim certified? Look for a valid certificate and understand what it actually covers.Can the brand explain its sourcing? Ask whether the cotton can be traced from the farm to the finished garment.What is known about water and chemical management? Look for specific evidence rather than broad environmental promises.Is the garment built to last? Consider the fabric quality, stitching, care instructions and availability of repair options.Does the company explain the returns to farmers? Responsible-sourcing claims should not overlook the economic realities faced by growers.What happens when the garment is no longer usable? Check whether repair, reuse or recycling options are realistically available. Brands should explain the scope of their sustainability claims in clear, accessible language. Where supporting evidence is unavailable, that limitation should be acknowledged rather than concealed behind terms such as “green”, “natural” or “conscious”. For businesses, stronger traceability can be more than a compliance exercise. Reliable records can help identify supply-chain risks, respond to buyer requirements and distinguish documented performance from marketing claims. However, the cost of certification and documentation also matters. A credible sourcing model should consider whether smaller farmers and suppliers can participate without facing a disproportionate financial or administrative burden. Following World Cotton Day, the central lesson is clear: cotton may be natural, but its sustainability must be demonstrated. It depends on how the crop is grown, how farmers and workers are treated, how the material is processed, how long the garment lasts and whether its environmental claims can be verified. The next time a shirt carries a sustainability label, the most useful question is not simply what the label says. It is what evidence stands behind it.Sources FAO — Cotton: Markets and Trade. Background on cotton’s role in livelihoods, employment, trade and competition with other fibres. https://www.fao.org/markets-and-trade/commodities-overview/fibres/enFAO — World Cotton Day, 7 October. Background on the annual observance and the 2026 theme, Cotton for Good: Building Prosperity Through Trade, Transformation and Partnership. https://www.fao.org/world-cotton-day/world-cotton-day-7-october/3/enAPEDA / National Programme for Organic Production — Chain of Custody for Indian Organic Fibres and Products. Requirements for certified organic fibre and supply-chain documentation. https://npop.apeda.gov.in/sites/default/files/announcements/Notifications_organic_textiles_1402202011032020.pdfVitale et al., Journal of Agriculture and Food Research (2025) — “Environmental sustainability of cotton: a systematic literature review of life cycle assessments.” Review of environmental impacts across cotton cultivation, processing and use. https://doi.org/10.1016/j.jafr.2025.102069Bhargavi, Blaise and Nalayini, Cleaner Water (2025) — “Water footprint, runoff and soil loss assessment of cotton production in central India.” Study of rain-fed and drip-irrigated cotton under the conditions examined. https://www.sciencedirect.com/science/article/pii/S2950263225000572Kumar et al., The Indian Journal of Agricultural Sciences — “Field validation of integrated pest management strategy in Bt cotton under farmers’ participatory mode in central India.” Study of integrated pest management in Khandwa, Madhya Pradesh, during the 2022–2024 rainy seasons. https://epubs.icar.org.in/index.php/IJAgS/article/view/168748Press Information Bureau, Ministry of Textiles (2026) — Kasturi Cotton Bharat programme background. Programme information and certification figures reported as of 30 June 2026. https://www.pib.gov.in/PressReleasePage.aspx?PRID=2286497 ...Read more
06 Oct 2026

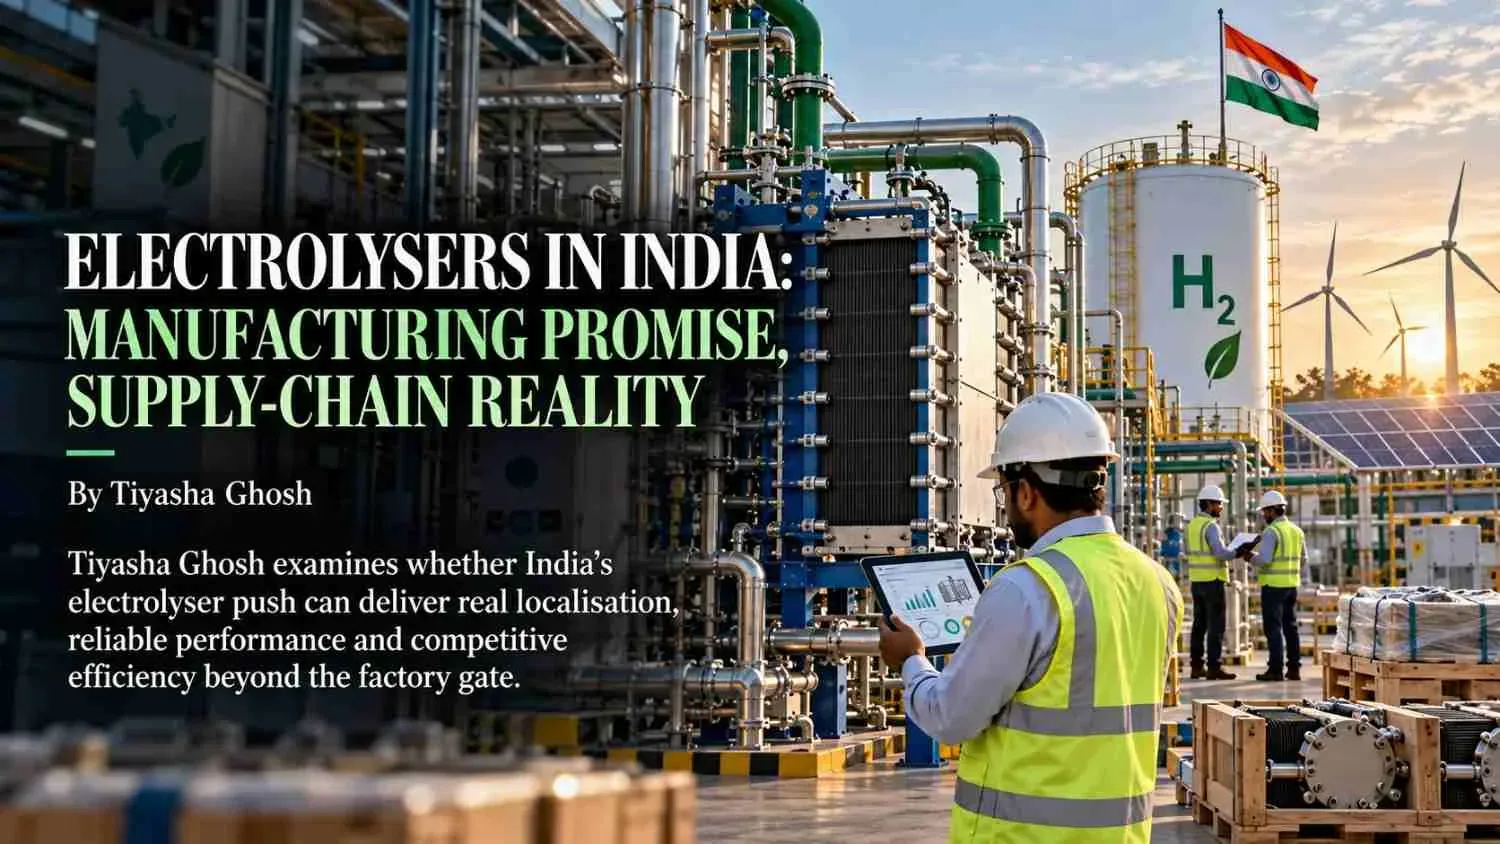
India is building the machines that could power its green-hydrogen ambitions. But the harder test is whether those machines can deliver competitive efficiency, genuine localisation and dependable performance long after the factory gates open. SummaryIndia is rapidly building a domestic electrolyser manufacturing base to support its green-hydrogen ambitions, backed by the National Green Hydrogen Mission and ₹4,440 crore in manufacturing incentives. But approved factory capacity is only the starting point. The real test lies in how much equipment is actually produced, how much of its supply chain is truly local, how efficiently it operates, and whether it can remain reliable and commercially competitive over time. This feature examines the gap between manufacturing promises and operating reality - through localisation, critical minerals, system costs, efficiency, degradation, renewable-power requirements and the evidence buyers should demand before calling an electrolyser truly “Made in India.” THE BIG QUESTION Can India turn electrolyser manufacturing capacity into a genuinely competitive industrial supply chain? India’s green-hydrogen story is gradually becoming a manufacturing story. The country is no longer viewing electrolysers simply as imported equipment required for future hydrogen projects. Through the National Green Hydrogen Mission and its Strategic Interventions for Green Hydrogen Transition (SIGHT) programme, India is seeking to establish a domestic manufacturing base for the equipment that splits water into hydrogen and oxygen. The scale is significant. The National Green Hydrogen Mission aims to position India as a global hub for green hydrogen and targets production of 5 million tonnes per annum by 2030. Under the SIGHT programme, the government has allocated ₹4,440 crore for domestic electrolyser manufacturing. The official MNRE SIGHT portal lists 3,000 MW per year of approved electrolyser manufacturing capacity across two manufacturing tranches: 1,500 MW under Tranche-I and another 1,500 MW under Tranche-II. The headline, therefore, is no longer whether India intends to manufacture electrolysers. It does. The more important question is what exactly “manufacturing” means when the system is examined component by component. INDIA’S ELECTROLYSER MANUFACTURING PUSH Infographic: National Green Hydrogen Mission → SIGHT → Tranche-I: 1,500 MW/year → Tranche-II: 1,500 MW/year → 3,000 MW/year approved capacity Callout: How much of that capacity will translate into actual production? Note: Clearly label 3,000 MW as approved/awarded manufacturing capacity, not equipment produced. FROM HYDROGEN TARGET TO FACTORY FLOOR An electrolyser is deceptively simple in principle. Electricity is passed through water, triggering an electrochemical reaction that separates hydrogen from oxygen. But the machine performing that reaction is a sophisticated industrial system involving a stack, electrodes, catalysts, membranes or diaphragms, bipolar plates, power electronics, pumps, heat-management systems, controls and other balance-of-plant equipment. And not every electrolyser is the same. Alkaline, PEM, solid-oxide and emerging AEM technologies use different materials, designs and operating characteristics. Their supply chains can therefore look very different. This matters because a factory producing an electrolyser system is not necessarily producing every critical component within it. A system can be assembled domestically while some of its most specialised inputs remain imported. That distinction lies at the centre of India’s manufacturing challenge. The policy objective, therefore, is not simply to increase the number of machines carrying a “Made in India” label. It is to build an industrial ecosystem capable of producing reliable equipment at competitive cost while reducing vulnerable import dependencies. The editorial brief for this feature identifies precisely these tests: quality, localisation, minerals, efficiency and after-sales performance—not factory ribbon-cutting. CAPACITY IS NOT THE SAME AS OUTPUT The first number any manufacturing story tends to celebrate is capacity. But capacity is only the beginning. A manufacturer may announce a plant with a particular annual nameplate capacity. A government tender may award manufacturing capacity. A facility may be constructed. Equipment may be installed. Production may begin. These are different stages. For this story, the useful ladder is: ANNOUNCED → AWARDED → BUILT → COMMISSIONED → PRODUCING → SOLD → INSTALLED → OPERATING → MAINTAINED → MEASURED The MNRE portal lists eight Tranche-I projects with scheduled commissioning dates in August 2026, while the listed Tranche-II projects have a scheduled commissioning date of 26 March 2027. As of October 2026, however, a scheduled commissioning date should not automatically be interpreted as evidence of actual commercial output. The evidence threshold must be higher. India’s electrolyser manufacturing progress should increasingly be measured through harder indicators: How much capacity has been physically commissioned?How much equipment has actually been produced?What is the plant’s utilisation rate?How many stacks or systems have been sold?Where are they operating?What is their measured efficiency?How quickly does performance degrade?What does the warranty cover?Which components are domestically sourced?Which remain imported?How quickly can replacement parts be supplied?This is where the story moves from industrial policy to industrial reality. CAPACITY ≠ OUTPUT Status ladder: Announced → Awarded → Built → Commissioned → Producing → Sold → Operating → Measured Centre callout: 3,000 MW/year = approved manufacturing capacity, not 3,000 MW produced. WHAT DOES “MADE IN INDIA” REALLY MEAN? The phrase sounds straightforward. The supply chain is not. A complete electrolyser system can contain dozens of components and materials, and the domestic share can differ substantially between technologies. A 2024 CEEW assessment examined PEM, alkaline and solid-oxide electrolysers and found substantial potential for localisation across all three. It estimated overall indigenisation potential at 82% for PEM, 88% for alkaline and 85% for solid-oxide electrolysers. The report also identified specialised materials and critical minerals as continuing supply-chain challenges. The distinction is crucial: Potential indigenisation is not the same as current indigenisation. The CEEW assessment estimated manufacturing costs of roughly USD 350–400 per kW across the technologies it studied and identified opportunities to reduce stack costs through higher current density, lower catalyst loading, thinner coatings and alternative materials. For PEM systems, the report found that around 72% of manufacturing cost could be readily indigenised in its assessment, while components such as Nafion membranes and minerals including platinum and iridium remained areas of import dependence. For alkaline systems, the picture is different but still not completely domestic. The CEEW analysis identified opportunities to manufacture or process several components in India while pointing to continuing dependence on imported materials and commodities. So the question should move from: “How much of the electrolyser is Indian?” to: “Which parts are Indian, which are imported, and which supply chains could become bottlenecks as production scales?” That is a much more useful manufacturing question. WHAT ACTUALLY SITS INSIDE AN ELECTROLYSER? Technical cutaway: Stack, electrodes, catalyst, membrane/diaphragm, bipolar plates, power electronics, water treatment, cooling, gas handling and controls. Show two labels: Domestic manufacturing potential | Import / critical-material exposure Callout: “Made in India” is a supply-chain question, not just an assembly question. THE CRITICAL-MINERAL QUESTION The localisation debate cannot stop at factories. It has to reach the materials inside those factories. Electrolyser technologies use different combinations of materials, and some specialised components rely on minerals for which India does not have sufficient domestic resources or established supply chains. This creates a strategic dilemma. Trying to manufacture everything domestically may not always be technically or economically sensible. But relying heavily on a narrow group of foreign suppliers can create another vulnerability. The better objective is therefore supply-chain resilience. That can mean: developing domestic component manufacturing;processing imported raw materials within India where economically viable;reducing the quantity of critical minerals required per unit of hydrogen;developing alternative materials;diversifying international suppliers;building domestic testing and certification capabilities;investing in research into next-generation electrolyser technologies.The CEEW study specifically identifies reduced catalyst loading, alternative materials and technology development as potential routes to lower costs and increase localisation. The strategic question is not whether India can eliminate every import. It is whether India can prevent one imported component, mineral or technology from becoming a single point of failure. THE HIDDEN COST: THE SYSTEM AROUND THE STACK Another reason headline manufacturing capacity can be misleading is that the stack is only one part of the overall economics. CEEW’s assessment found that balance of plant can account for 50–60% of the total electrolyser system cost. That changes the procurement conversation. A buyer should not compare two electrolysers simply by comparing the quoted price of their stacks. The relevant comparison is the complete system. That includes: STACK + POWER ELECTRONICS + WATER TREATMENT + COOLING + GAS PROCESSING + CONTROLS + INSTALLATION + MAINTENANCE + REPLACEMENT + FINANCING A cheaper machine that consumes more electricity, degrades faster or requires expensive imported replacement parts may not remain cheaper over its operating life. The real metric is therefore not simply: ₹ per kW of electrolyser but increasingly: ₹ per kilogram of hydrogen over the operating life of the system. That is where manufacturing competitiveness becomes commercial competitiveness. THE STACK IS ONLY PART OF THE BILL Infographic: Stack + power conversion + water treatment + cooling + gas handling + controls + installation + maintenance. Highlight: Balance of plant = 50–60% of total system cost Bottom line: Purchase price ≠ lifetime cost EFFICIENCY: THE NUMBER THAT NEEDS A COMMON RULE Efficiency sounds like a simple number. In practice, it requires a common measurement framework. Two manufacturers can describe system performance differently depending on what is included in the calculation, how electricity consumption is measured and under what operating conditions the test is performed. That makes standardisation critical. A June 2025 BIS draft standard on efficiency assessment of AEM, PEM and alkaline water electrolysers note that different electrolyser technologies have different configurations, materials, operating conditions and performance characteristics. It also states that meaningful comparison requires a standardised procedure for evaluating system performance. The document highlights another important complication: some performance characteristics can be assessed during initial testing, while aspects related to equipment life become clearer only through operation and accelerated testing. For buyers, therefore, the important question is not merely: “What efficiency does the manufacturer claim?” It is: “Under what test protocol was that efficiency measured, at what load, and which parts of the system were included?” Without comparable testing, headline efficiency numbers can be difficult to use in procurement decisions. WHEN TWO EFFICIENCY NUMBERS ARE NOT COMPARABLE Comparison graphic: Two illustrative electrolyser test cards showing: Efficiency → Operating load → Temperature → Pressure → System boundary Centre: STANDARDISED TESTING Note: Do not use invented manufacturer numbers. THE PERFORMANCE TEST DOES NOT END WHEN THE MACHINE STARTS An electrolyser can perform well when new and still become a different economic proposition several years later. That makes degradation one of the most important—and least headline-friendly—questions in the sector. A serious buyer needs to know: How quickly does stack performance decline?What operating conditions accelerate degradation?How frequently does the stack need replacement?What is covered under warranty?What happens when efficiency falls below the guaranteed level?Who supplies replacement components?How long will critical spare parts remain available?Who carries the performance risk?These questions matter because hydrogen projects are not buying a machine for a photograph. They are buying an operating asset. If an electrolyser is expected to function for years, uptime, degradation and service availability can ultimately matter as much as its initial purchase price. The editorial brief therefore calls specifically for degradation data, warranty claims and signed customer orders, rather than relying only on factory-capacity claims. THE RENEWABLE POWER QUESTION There is another part of the electrolyser equation that sits outside the factory. Electricity. Green hydrogen is only as credible and economically viable as the renewable electricity system supporting its production. An electrolyser may be technically excellent, but its economics can deteriorate if the electricity feeding it is expensive, unreliable or poorly matched to its operating profile. This creates a second test for Indian manufacturing. Can domestically manufactured electrolysers operate efficiently under the actual renewable-power conditions that Indian projects will face? Solar-heavy systems, for example, can experience changing electricity availability throughout the day. That makes dynamic operation, power-electronics performance and degradation behaviour important procurement considerations. The machine therefore cannot be assessed in isolation. The chain is: RENEWABLE ELECTRICITY → WATER → ELECTROLYSER → HYDROGEN → STORAGE / TRANSPORT → INDUSTRIAL CUSTOMER A weakness anywhere along that chain can affect the economics of the final kilogram of hydrogen. THE HYDROGEN MOLECULE’S FULL ITINERARY Systems map: Renewable electricity → Water → Electrolyser → Hydrogen conditioning → Storage → Transport → Industrial buyer Under each stage, ask one short question: Power: Affordable? Water: Available? Electrolyser: Who made it? Performance: How efficient? Storage: What infrastructure? Transport: What cost? Buyer: Who pays? Callout: A green-hydrogen project is a chain, not a machine. INDIA’S ADVANTAGE — AND ITS COMPETITIVE PROBLEM India has a major reason to pursue domestic electrolyser manufacturing. It wants the economic benefits of the green-hydrogen transition to extend beyond hydrogen production itself into manufacturing, engineering, components, services and jobs. But the global market is already competitive. The International Energy Agency’s Global Hydrogen Review 2026 reports that installed global electrolysis capacity doubled in 2025 to more than 4 GW, with China accounting for nearly three-quarters of new installations. The IEA also says electrolyser manufacturing is entering a consolidation phase as market development remains slow. That creates a difficult environment for India. The country is attempting to build manufacturing capacity while the global industry itself is still searching for stable demand and sustainable economics. The challenge is therefore not simply to make electrolysers. It is to make them: CHEAP ENOUGH. EFFICIENT ENOUGH. RELIABLE ENOUGH. SERVICEABLE ENOUGH. to win real orders. That is a much higher bar. THE GLOBAL ELECTROLYSER RACE Global map: Highlight India and China. Show the comparison around: Scale | Cost | Technology | Project experience | Domestic demand | Export potential Bottom line: The competition is for cost, scale, reliability and customers—not just technology. THE GLOBAL LESSON: CHEAP EQUIPMENT IS NOT THE WHOLE STORY China’s position provides an important comparison. The IEA reports that China has become the leading centre for electrolyser deployment and manufacturing, benefiting from lower technology costs and experience with large projects. But the same analysis points to excess capacity and market consolidation. The lesson for India is not that domestic manufacturers must simply imitate China. It is that manufacturing scale alone does not guarantee sustainable industrial competitiveness. A country can have factories and still struggle with: weak demand;underutilised capacity;thin margins;imported critical components;insufficient testing infrastructure;limited after-sales networks;technology dependence;financing constraints;inadequate customer confidence. The strongest industrial ecosystem is therefore not necessarily the one with the largest announced factory capacity. It is the one whose manufacturers can continue delivering after subsidies, incentives and policy headlines become less central to the business case. THE REAL PROCUREMENT TEST For developers and industrial buyers, the questions should become more demanding. Before purchasing an electrolyser, a buyer should be able to request a documentary record covering at least: 1. FACTORY CAPACITY What is the annual nameplate capacity, and what is the actual production? 2. BILL OF MATERIALS What are the major components, and where does each come from? 3. TECHNOLOGY Is the system alkaline, PEM, SOEC, AEM or another configuration? 4. EFFICIENCY What test protocol produced the quoted efficiency figure? 5. DEGRADATION What performance decline is expected over time? 6. WARRANTY What exactly is guaranteed, for how long and under what operating conditions? 7. WATER What water quality does the system require, and what treatment infrastructure is necessary? 8. OPERATING EVIDENCE How many systems are actually operating, and for how long? 9. CUSTOMER EVIDENCE Are there signed customer orders rather than only memoranda or announcements? 10. LIFETIME ECONOMICS What is the expected total cost of producing hydrogen over the equipment’s operating life? This is the point where “Made in India” becomes a measurable industrial proposition rather than a branding exercise. BEFORE BUYING AN ELECTROLYSER, ASK FOR THE FILE ☐ Factory capacity vs. actual output ☐ Bill of materials ☐ Supplier origin ☐ Technology / chemistry ☐ Efficiency test protocol ☐ Degradation data ☐ Warranty terms ☐ Water requirement ☐ Operating customer evidence ☐ Lifetime hydrogen cost Callout: If the number matters to the business case, ask for the document behind the number. WHAT SHOULD INDIA MEASURE NEXT? India’s next manufacturing phase should be judged through a different dashboard. Not just: MW OF ANNOUNCED CAPACITY but: MW COMMISSIONED MW ACTUALLY PRODUCING UTILISATION RATE PERCENTAGE OF COMPONENTS LOCALLY SOURCED CRITICAL-MATERIAL EXPOSURE MEASURED SYSTEM EFFICIENCY ANNUAL DEGRADATION STACK REPLACEMENT INTERVAL WARRANTY PERFORMANCE NUMBER OF OPERATING CUSTOMER SYSTEMS SYSTEM AVAILABILITY COST PER KILOGRAM OF HYDROGEN These indicators would reveal whether the domestic electrolyser industry is moving from policy-supported capacity creation towards commercially durable manufacturing. The government intervention has already created a strong market signal: according to MNRE, 15 companies have been awarded 3,000 MW/year of electrolyser manufacturing capacity with ₹4,440 crore in total incentives. The next phase is about proving what those numbers produce in practice. FROM ANNOUNCEMENTS TO OPERATING DATA OLD MEASUREBETTER MEASUREAnnounced MWCommissioned MWFactory capacityActual outputLocal assemblyLocal component shareClaimed efficiencyStandardised tested efficiencyNew equipmentOperating equipmentPurchase priceLifetime costWarranty promiseWarranty performanceCustomer announcementSigned order + operating evidence THE BUSINESS CASE BEHIND THE CLIMATE CASE There is a tendency to frame green hydrogen as a climate technology first and an industrial technology second. For electrolysers, the order increasingly needs to be reversed. The climate ambition depends on industrial performance. If electrolysers are expensive, inefficient or unreliable, green hydrogen becomes more expensive. If green hydrogen remains expensive, demand can remain weak. If demand remains weak, manufacturing plants can operate below capacity. If factories operate below capacity, domestic suppliers struggle to build economies of scale. And if component suppliers cannot scale, import dependence can persist. That creates a cycle: HIGH EQUIPMENT COST ↓ EXPENSIVE HYDROGEN ↓ WEAK DEMAND ↓ LOW FACTORY UTILISATION ↓ LIMITED SCALE ↓ WEAK SUPPLY CHAIN India needs to build the opposite cycle: RELIABLE EQUIPMENT ↓ COMPETITIVE HYDROGEN ↓ STRONGER DEMAND ↓ HIGHER UTILISATION ↓ SUPPLIER SCALE ↓ LOWER COST ↓ STRONGER DOMESTIC INDUSTRY That is the real industrial prize. THE BUSINESS-CASE CYCLE Risk cycle: High cost → Expensive hydrogen → Weak demand → Underused factories → Weak supply chain Industrial cycle: Reliable equipment → Competitive hydrogen → Demand → Scale → Lower cost → Stronger industry Centre question: Which cycle will India’s electrolyser industry enter? WHAT THE EVIDENCE SHOULD LOOK LIKE The strongest version of this story is not built around the number of factories announced. It is built around documents. For each major manufacturing claim, the evidence hierarchy should move from: Policy announcement → Letter of award → Factory commissioning evidence → Production data → Customer order → Operating data → Performance data → Independent verification, where available This distinction matters because announcements are not equivalent to operational outcomes. For this reason, the article should not claim that every SIGHT-listed factory is already producing at its awarded capacity unless documentary evidence establishes that. The absence of such evidence is itself important. It tells the reader where India’s manufacturing story currently has a measurement gap. THE EVIDENCE LADDER Announced → Awarded → Commissioned → Producing → Operating → Measured → Independently verified Callout: The higher the evidence, the stronger the claim. THE BOTTOM LINE India has moved beyond the stage where electrolyser manufacturing is merely an aspiration. Policy support exists. Manufacturing capacity has been awarded. Companies are developing production capabilities. The potential for substantial localisation is real. But: CAPACITY IS NOT YET COMPETITIVENESS. A factory can have a nameplate capacity without producing at that level. A machine can be assembled domestically while relying on imported critical components. A low purchase price can conceal higher lifetime electricity, maintenance or replacement costs. And a promising technology can still struggle if customers cannot secure affordable renewable electricity or dependable long-term service. The next chapter of India’s electrolyser story therefore needs fewer ribbon-cutting numbers and more operating numbers. The decisive evidence will come from: production records, component origins, standardised efficiency tests, degradation data, warranties, customer orders, operating experience and lifetime cost. India does not simply need electrolyser factories. It needs an electrolyser industry that can: SURVIVE AFTER INCENTIVES. COMPETE AFTER HEADLINES. PERFORM LONG AFTER THE RIBBON IS CUT. Because a factory can make a stack. The real question is whether the stack can make a business case.SOURCES & DOCUMENTATION: Ministry of New and Renewable Energy — National Green Hydrogen Mission / SIGHT approved projects MNRE National Green Hydrogen Mission — SIGHTMinistry of New and Renewable Energy — SIGHT Supply Incentives MNRE — SIGHT Supply IncentivesPress Information Bureau / MNRE — National Green Hydrogen Mission progress PIB — National Green Hydrogen Mission progressPress Information Bureau / MNRE — Green Hydrogen expansion and electrolyser manufacturing PIB — Green Hydrogen expansion and electrolyser manufacturingMNRE — India's Green Hydrogen Revolution MNRE — India's Green Hydrogen RevolutionCouncil on Energy, Environment and Water — How can Hydrogen Electrolysers be Made in India? CEEW — Hydrogen Electrolyser Manufacturing in IndiaInternational Energy Agency — Global Hydrogen Review 2026 IEA — Global Hydrogen Review 2026International Energy Agency — Global Hydrogen Review 2026: Production IEA — Global Hydrogen Review 2026: ProductionBureau of Indian Standards — Draft efficiency assessment standard for electrolysers BIS — Draft efficiency assessment standard ...Read more

31 Aug 2026

Kolkata |31 August, 2026 India’s construction boom is creating a narrow window to cut emissions before new commercial and residential buildings lock in decades of energy demand. Green standards, low-carbon materials, efficient cooling and occupant wellness are becoming central to that transition. Summary India’s building sector is expanding rapidly, making construction and building operations an important part of the country’s decarbonisation challenge. Buildings already account for a significant share of India’s electricity demand, while much of the building stock that will exist in the coming decades is yet to be constructed. Green-building frameworks such as IGBC and GRIHA are pushing developers towards better energy, water, material and indoor-environment performance. BEE has also strengthened the policy framework through the Energy Conservation and Sustainable Building Code 2024 and Eco Niwas Samhita 2024. But certification alone cannot prove that a building is genuinely low-carbon. The bigger test is whether developers reduce embodied carbon in materials, improve HVAC performance, lower actual energy use and deliver measurable benefits for occupants after the building becomes operational. Can India’s real-estate boom become a decarbonisation opportunity instead of an emissions trap?India is entering a major phase of construction, with new offices, homes, hotels, hospitals and commercial developments expanding across its cities. Every building project makes decisions that can shape energy demand, cooling needs, material use and water consumption for decades. That creates both a challenge and an opportunity. A poorly designed building can lock in high energy consumption long after construction is complete. A well-designed one can reduce that demand from the outset through passive design, energy-efficient systems, lower-carbon materials and renewable energy. This is why the net-zero real-estate conversation is moving beyond visible measures such as solar panels and efficient lighting. The bigger question is how a building is designed, what materials go into it, how efficiently it operates and whether the people inside it actually experience healthier and more comfortable conditions. In other words, decarbonising real estate is not just about making buildings consume less electricity. It is about reducing their environmental footprint from construction and material choices through everyday operation and occupant wellbeing.   WHERE A BUILDING’S CARBON COMES FROM CONSTRUCTION Cement + steel + glass + transport↓ EMBODIED CARBON OPERATION Electricity + cooling + lighting + equipment↓ OPERATIONAL CARBON OCCUPANCY Thermal comfort + daylight + ventilation + indoor air quality↓ OCCUPANT WELLNESS NET-ZERO BUILDING Materials + energy + people + performance   Are green-building certifications enough to prove that a building is genuinely sustainable?India has developed two major voluntary green-building frameworks: the Indian Green Building Council (IGBC) and the GRIHA Council. Both assess buildings against a range of sustainability criteria, although their rating systems and approaches are not identical. IGBC offers rating systems for areas including new buildings, homes and net-zero buildings, while GRIHA evaluates factors such as energy and water use, materials, waste management, site planning and occupant-related performance. But certification should not be treated as simply a green label. It can demonstrate that a project has met a defined set of sustainability criteria. The harder test comes after the building is occupied.Does it perform as promised when it is put to real-world use?A developer may secure certification during the design or construction stage, but the building's real energy and resource performance becomes clearer only after it begins operating. Actual occupancy, cooling demand, equipment use and maintenance can all affect its performance. That makes the evidence behind the claim just as important as the certification itself. A credible assessment should establish the baseline, the performance target, the methodology used and the comparison point. It should also show how much energy the building actually consumes per square metre and whether that performance continues to be monitored after certification. This distinction becomes even more important for net-zero claims. A building may perform efficiently during operation, but its overall environmental footprint also depends on factors such as the materials used in construction and the emissions associated with producing and transporting them. Certification can show that a building meets a standard. Long-term performance data is what shows whether that standard translates into real-world sustainability.Can green cement and recycled steel cut the carbon hidden inside construction? Operational energy is only one part of a building’s carbon footprint. A building may use relatively little electricity once it is occupied and still carry significant emissions from the materials used to construct it. Those emissions are generated before the building is even ready for use, through activities such as mining, processing, manufacturing and transportation. This is why cement and steel are at the centre of the embodied-carbon debate. Developers and material manufacturers are increasingly exploring lower-carbon cement, alternative binders, recycled steel and more efficient use of construction materials to reduce emissions at this stage. But calling a material “green” is not enough. The real test is what changed compared with the conventional alternative. What material was replaced? What was its original carbon intensity? How much recycled content was actually used? Where was the material sourced from? What lifecycle boundary was used to calculate the reduction? And how much carbon was genuinely avoided? Without a clear baseline and reporting methodology, a percentage reduction can sound impressive while providing little information about its actual environmental impact. For a credible net-zero building claim, material-level emissions need to be traceable across the project's defined reporting boundary - from sourcing and manufacturing through construction and, where relevant, the building's future lifecycle. The goal is not simply to use greener materials. It is to prove how much carbon those choices actually prevent from entering the atmosphere.  THE EMBODIED-CARBON CHECKCONVENTIONAL MATERIAL Cement / steel↓BASELINE CARBON LOWER-CARBON MATERIAL Green cement / recycled steel↓ACTUAL CARBON ↓ MEASURED MATERIAL SAVING Baseline − Actual = Reduction Add: recycled content + source + lifecycle boundary + quantity used   Could HVAC design become the biggest operational test for green buildings?For India, cooling cannot be treated as an afterthought. As temperatures rise and air-conditioning becomes increasingly important across offices, homes, hospitals and commercial buildings, the way a building manages heat can have a major impact on both energy use and emissions. The Bureau of Energy Efficiency (BEE) building-efficiency framework covers areas including mechanical systems, HVAC, building envelopes, lighting, electrical systems and renewable energy. The Eco Niwas Samhita 2024 also focuses on residential building-envelope performance, with measures aimed at reducing heat gain while improving natural ventilation and daylighting. The logic is simple: a building that absorbs more heat needs more cooling, more cooling requires more electricity, and where electricity remains carbon-intensive, higher demand can mean higher operating emissions. That is why efficient HVAC systems cannot work in isolation. They need to be combined with insulation, shading, appropriate glazing, building orientation, ventilation and better envelope design. The more important question is therefore not simply: How efficient is the air-conditioner? It is: Why does the building need so much cooling in the first place?Building codes also play a crucial role. BEE's energy-efficiency standards provide a national framework, while state urban-development departments and local building authorities influence approvals, enforcement and implementation. MoHUA's urban-building policy framework and local development rules can further determine how sustainability requirements are translated into actual projects. This creates a potential implementation gap. A strong national standard can deliver limited results if compliance and enforcement remain weak at the city or project level.Does a green building still work if its occupants are uncomfortable?  This is where the human side of green construction becomes impossible to ignore. A building may report lower energy consumption while its occupants continue to experience excessive heat, poor ventilation, glare, noise or indoor-air-quality problems. Lower energy use alone therefore cannot determine whether a building is genuinely performing well. Occupant wellness needs to be treated as an outcome, not an optional feature added to a sustainability checklist. For offices, hotels, hospitals and residential buildings, relevant indicators can include: Thermal comfortIndoor air qualityDaylight accessVentilationAcoustic comfortOccupant satisfactionAccess to natural light and outdoor spaces The evidence should come from the people using the building as well as from its building-management systems. A developer's sustainability report can show energy consumption and technical performance. Occupant surveys can reveal whether those improvements actually translate into a building that is comfortable, healthy and functional for the people inside it. A building cannot be considered truly green if it saves energy on paper but compromises the people who have to live or work inside it. THE GREEN-BUILDING SCORECARD  AreaWhat should be measured?EnergykWh/m²/yearCarbonAbsolute + intensity emissionsMaterialsEmbodied carbonCementCarbon intensity + alternativesSteelRecycled content + lifecycle impactHVACEnergy performance + cooling demandWaterConsumption + reuseOccupantsComfort + air quality + satisfactionCertificationRating + post-occupancy performanceInvestmentBudget/capex + actual spendingContinuityPerformance after handover   Is India's building policy moving fast enough to match the construction boom?India already has a growing policy framework aimed at improving building efficiency and sustainability. The Energy Conservation and Sustainable Building Code 2024 and Eco Niwas Samhita 2024 provide updated approaches to energy performance and sustainable building design, while BEE also operates a voluntary star-rating programme for commercial buildings based on their actual energy performance. But a standard has value only when it moves from policy documents into real buildings. That means looking beyond whether developers have adopted a requirement on paper and examining whether it is followed through design, construction and everyday operation. State urban-development departments, municipal corporations and local building authorities also have an important role in approvals, development rules, implementation and enforcement, particularly where voluntary green-building standards overlap with mandatory regulations. The evidence should therefore separate five very different milestones: a target announced, a design approved, a certification obtained, a building completed and a building actually performing as promised. These milestones are not interchangeable, and treating them as one can make a project appear further ahead than it really is.What happens when green buildings cost more upfront? Cost remains one of the strongest arguments against more aggressive green-building requirements. Energy-efficient building envelopes, advanced HVAC systems, lower-carbon materials, smart controls and renewable-energy installations can all require greater upfront investment. That can encourage developers to prioritise measures with faster financial returns. But the calculation looks different when a building is assessed across its full operating life. Higher initial investment can potentially reduce electricity consumption, cooling requirements and maintenance costs over time. The better question is therefore not simply how much a green building costs to construct, but what environmental and financial outcomes that additional investment produces? A credible assessment should ask: How much additional capital expenditure was required? How much energy was saved? How much did annual operating costs fall? What was the payback period? And did the building continue to deliver those savings after handover? The money itself also needs to be traceable. A large sustainability commitment announced in an annual report is not the same as money actually spent on a completed project.Can India's developers move from green certification to genuine net-zero performance?Ultimately, the answer will depend on what the sector chooses to measure and disclose. The strongest projects will not stop at reporting the number of green-certified buildings. They will show baseline energy use, actual energy intensity, embodied-carbon calculations, renewable-energy generation, water consumption, occupant outcomes, capital expenditure and post-occupancy performance. The comparison point matters just as much. A claim that a building uses 30% less energy may sound significant, but 30% less than what? Was it compared with a conventional code-compliant building? An earlier version of the same project? Or a comparable building operating in the same climate? Without a credible baseline, even a large percentage reduction can be difficult to interpret. Net-zero performance is ultimately about measurable change, not simply the presence of a green label or the size of a sustainability claim.   ANNOUNCEMENT VS OUTCOME GREEN TARGET ANNOUNCED ↓ DESIGN ↓ CONSTRUCTION ↓ CERTIFICATION ↓ OCCUPANCY ↓ ACTUAL PERFORMANCE Energy ↓ | Carbon ↓ | Cooling demand ↓ | Water ↓ | Comfort ↑ The real green-building story begins after the ribbon-cutting.   So, can India's real estate sector decarbonise before the grid does?It can reduce a significant part of the demand it places on the grid. But “net-zero” requires more than efficient equipment or a green certification. It requires a clear boundary around emissions, credible assumptions, measurable reductions and transparency about renewable energy and any offset reliance. The first priority should be reducing demand. That means designing buildings that need less cooling, using efficient systems, reducing material emissions and improving water and resource efficiency. Renewable energy can then address part of the remaining electricity demand. Offsets, where used, should be clearly separated from actual emissions reductions. The strongest net-zero building is therefore not the one with the most impressive sustainability label. It is the one that can show what its baseline was, what changed, how much it cost, what occupants experienced and whether the performance continued after the project was completed. THE REAL NET-ZERO BUILDING TEST Build less carbon into the structure.Use less energy to operate it.Cool it intelligently.Measure what occupants experience.Follow the money.Report actual performance.Keep measuring after certification. India's construction boom is creating a narrow window. What gets built today will shape the country's energy demand for decades. The question is no longer whether India can build greener buildings. It is whether it can prove that those buildings stay green once people move in.   Sources:  Bureau of Energy Efficiency (BEE) — Energy Conservation and Sustainable Building Code 2024 (ECSBC 2024)Useful for: commercial/office building energy-efficiency requirements, building envelope, HVAC, lighting, electrical systems and sustainable-building provisions. BEE — ECSBC 2024 BEE — Eco-Niwas Samhita 2024Useful for: residential building energy performance, building-envelope requirements, heat gains, daylight and natural ventilation. BEE lists the 2024 ENS among its current building-efficiency resources. BEE — Eco-Niwas Samhita 2024 BEE — Building Energy Efficiency / Energy Efficiency ResourcesUseful for: India's building-sector energy-efficiency framework, commercial-building performance and retrofit/cooling resources. BEE — Building Energy Efficiency Resources Indian Green Building Council (IGBC) — Green New Buildings Rating SystemUseful for: IGBC certification, energy efficiency, water conservation, building materials, indoor environmental quality, certification levels and the transition to Version 4.0 from May 2026. IGBC — Green New Buildings IGBC — Net Zero Carbon RatingThis is especially important for your article. It supports the distinction between design/construction-stage and operations-stage certification, embodied-carbon requirements and operational-carbon requirements. It also states that the certification is valid for three years, reinforcing your argument that performance needs to be monitored rather than treated as a permanent achievement. IGBC — Net Zero Carbon Rating IGBC — Green Existing Buildings Rating SystemUseful for: operational performance, mandatory energy/water/fresh-air requirements, certification review and the importance of final documentation rather than relying only on anticipated performance. IGBC — Green Existing Buildings IGBC — Green Homes Rating SystemUseful for: the residential side of your story and current Green Homes Version 3.0 framework. IGBC — Green Homes ...Read more

01 Aug 2026

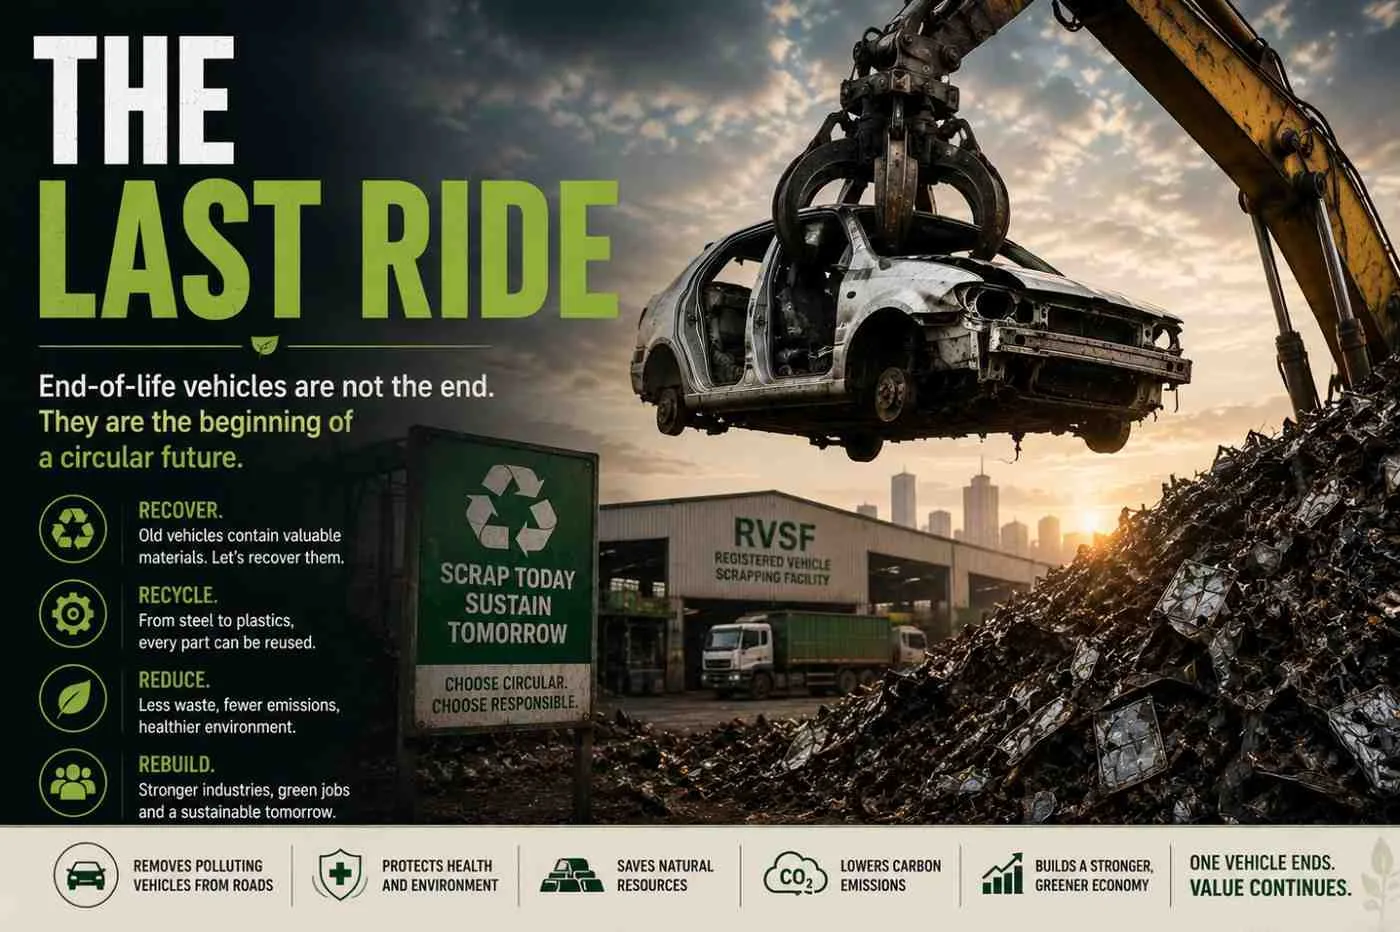
India's growing vehicle scrappage ecosystem is transforming end-of-life vehicles into valuable resources, but the success of a circular material economy will depend on formal recycling, stronger infrastructure and public participation  Kolkata | August 1, 2026:Every vehicle eventually reaches the end of its useful life. The real question is what happens next. For years, old and damaged vehicles in India were largely dismantled in informal scrapyards, where valuable materials were recovered with little environmental oversight or scientific waste management.  Today, that approach is gradually giving way to a more organised system. As India expands its vehicle scrappage programme and establishes authorised recycling facilities, end-of-life vehicles (ELVs) are beginning to play a much larger role in the country's transition towards a circular economy. The shift comes at an important moment. India is one of the world's largest automobile markets, and millions of vehicles are expected to retire from the roads over the next decade. Managing this growing volume is no longer just about disposing of ageing vehicles. It is becoming an opportunity to recover valuable resources, reduce industrial waste and strengthen sustainable manufacturing. Under the government's Vehicle Scrappage Policy, ageing and unfit vehicles are encouraged and in certain cases required- to undergo fitness assessments before being transferred to Registered Vehicle Scrapping Facilities (RVSFs). These authorised centres are designed to dismantle vehicles scientifically, safely handle hazardous components and recover reusable materials such as steel, aluminium, copper, plastics, and rubber. Experts believe this approach could significantly improve India's resource efficiency. Recovering metals from scrapped vehicles requires far less energy than extracting and processing newly mined raw materials, helping reduce both production costs and carbon emissions.Recycled steel and aluminium are also expected to become increasingly valuable as demand continues to grow across the automotive, construction and infrastructure sectors.Yet building an efficient circular material chain remains a complex task. A substantial portion of vehicle dismantling is still carried out by the informal sector, which has supported recycling activities for decades through well-established local networks. While these businesses recover a significant amount of recyclable material, environmental safeguards, worker safety standards and material traceability often remain inadequate. Integrating informal operators into a regulated recycling ecosystem is therefore seen as one of the biggest challenges facing the sector. Infrastructure presents another hurdle. Expanding the number of authorised scrapping facilities is only part of the solution. Experts say the wider ecosystem-including testing centres, dismantling capacity and supporting infrastructure- still falls short in many parts of the country.The transition also faces another obstacle: participation. Public awareness of the scrappage policy remains limited, while logistical constraints and uneven implementation across states continue to slow the growth of formal recycling systems. Experts believe that without meaningful economic incentives, encouraging wider participation from vehicle owners will remain a significant challenge. Vehicle owners are more likely to participate when scrapping offers tangible financial benefits through tax concessions, incentives or discounts on new vehicle purchases. At the same time, manufacturers stand to benefit from a more dependable supply of recycled materials, strengthening supply-chain resilience while reducing dependence on newly extracted resources. The advantages extend well beyond the automobile industry. A well-developed vehicle recycling ecosystem can reduce landfill waste, improve air quality by replacing highly polluting vehicles and create new employment opportunities across dismantling, material recovery, recycling, and secondary manufacturing. It also supports India's wider objectives of improving resource efficiency, lowering industrial emissions and promoting circular economy practices within domestic manufacturing. Environmental experts believe that transition cannot end with vehicle recycling alone.A truly circular automotive sector will require vehicles to be designed for easier recycling, valuable materials to be recovered more efficiently, battery recycling systems to expand and manufacturers to take greater responsibility for the entire life cycle of their products. As India's vehicle population continues to grow, the country's next sustainability milestone may not be measured by how many new vehicles are manufactured, but by how responsibly older ones are managed at the end of their life. The programme's success will not be measured by the number of vehicles it dismantles, but by the value it creates from them. It will be measured by how effectively yesterday's vehicles are transformed into tomorrow's resources, reducing waste, conserving raw materials and strengthening India's circular economy. The journey of a vehicle should not end at the scrapyard. In a truly sustainable economy, it should continue through the materials it leaves behind - fueling new industries, conserving natural resources and reinforcing the idea that the most valuable resources are often those already in our hands. Sources: Ministry of Road Transport and Highways (MoRTH) – Vehicle Scrapping Policy: Notifications and Ruleshttps://www.morth.gov.in/en/Circulars-Notifications-related-to-Vehicle-Scrapping-PolicyPress Information Bureau (PIB) – Vehicle Scrapping Policy: Progress of Registered Vehicle Scrapping Facilities (RVSFs)https://www.pib.gov.in/PressReleasePage.aspx?PRID=2099130&lang=2&reg=48National Government Services Portal – Registered Vehicle Scrapping Facility (RVSF) Portalhttps://services.india.gov.in/service/detail/apply-for-registered-vehicle-scrapping-facilityMinistry of Road Transport and Highways – State-wise Registered Vehicle Scrapping Facility (RVSF) Notificationshttps://www.morth.gov.in/en/rvsf-notificationsCentral Pollution Control Board (CPCB) – Environmentally Sound Management of End-of-Life Vehicleshttps://cpcb.nic.in/NITI Aayog – Reports on Circular Economy and Resource Efficiencyhttps://www.niti.gov.in/Down To Earth – Coverage on vehicle scrappage, recycling and the circular economy in Indiahttps://www.downtoearth.org.in/The Energy and Resources Institute (TERI) – Research on resource efficiency, recycling and circular economyhttps://www.teriin.org/Ministry of Steel, Government of India – Steel recycling and secondary raw materials initiativeshttps://steel.gov.in/Press Information Bureau (PIB) – Voluntary Vehicle Fleet Modernization Programme (Vehicle Scrapping Policy)https://www.pib.gov.in/newsite/erelcontent.aspx?lang=2&reg=48&relid=265928 ...Read more

31 Jul 2026

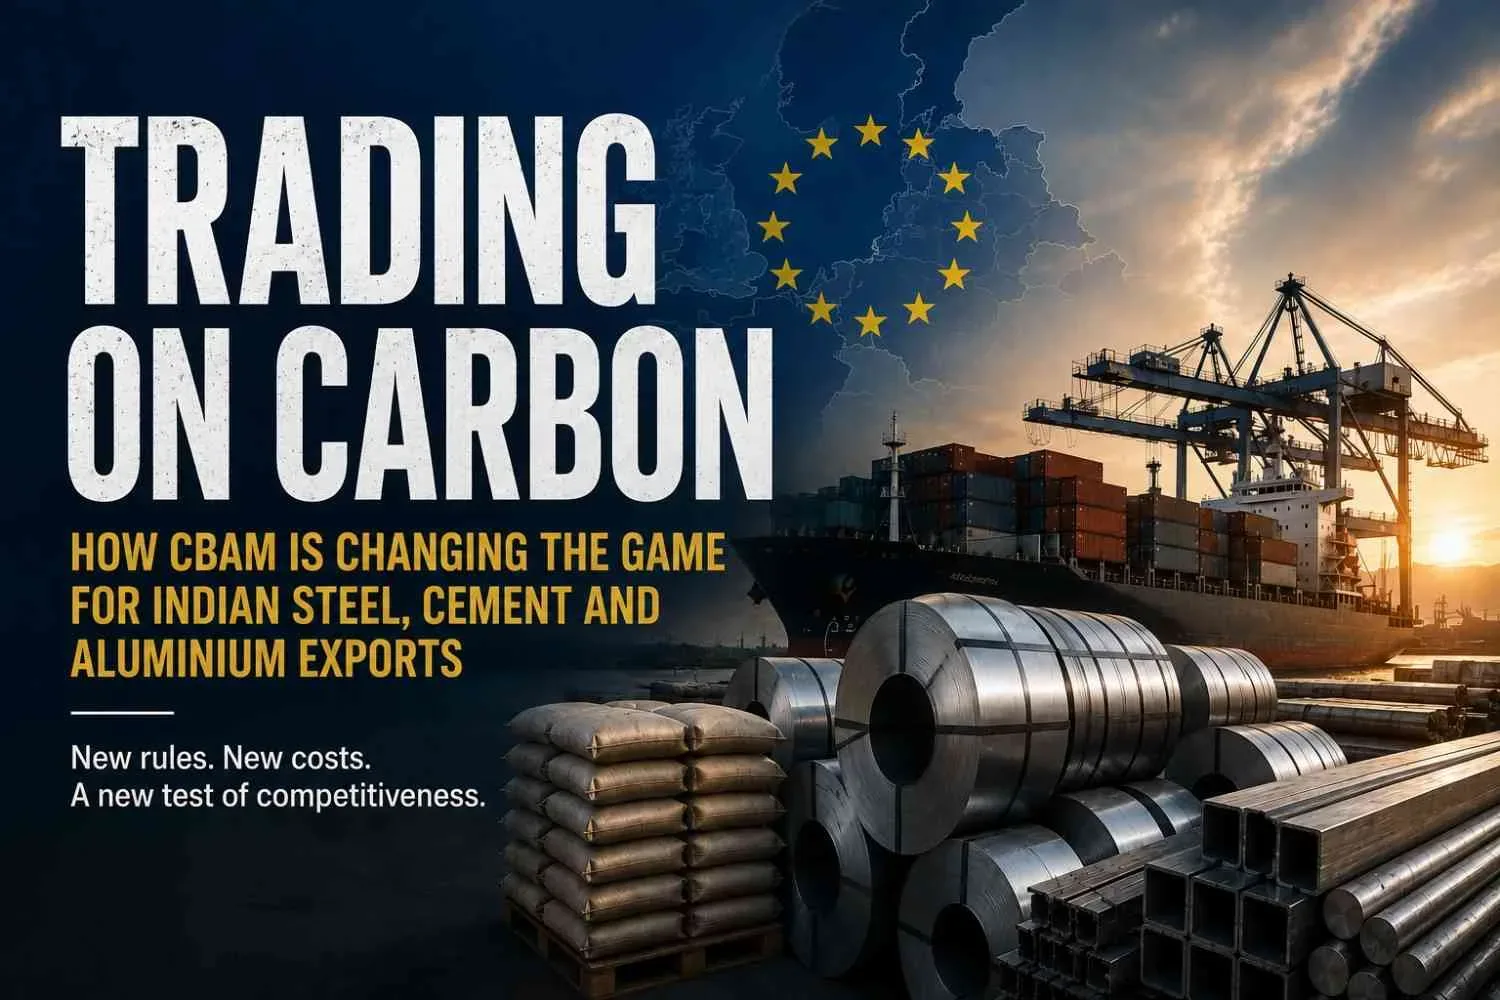
As Europe tightens its carbon border rules, Indian steel, cement and aluminium exporters face a new test of competitiveness   Kolkata | July 31, 2026: What if the next barrier to global trade is not tariffs or product standards, but carbon emissions? As the European Union moves closer to fully implementing its Carbon Border Adjustment Mechanism (CBAM), that question is becoming relevant. The policy is expected to redefine trade in carbon-intensive products, with Indian exports of steel, cement and aluminium among those likely to feel its impact. The Carbon Border Adjustment Mechanism is designed to tackle "carbon leakage"- the practice of shifting production to countries with weaker climate regulations while continuing to supply European markets. Under the new system, importers into the EU will have to pay a carbon price on products manufactured in countries that do not have comparable carbon pricing measures.For Indian exporters, the policy marks a significant shift in the rules of global trade.For India, the stakes are particularly high. The country is among the world's largest producers of steel and aluminium, with the European Union representing an important export market for both. As CBAM moves into its next phase, exporters will need to provide verified emissions data and may face additional carbon-related costs if their products are produced through carbon-intensive processes.Experts say the debate is no longer confined to climate policy. It is rapidly becoming a question of who remains competitive in global markets and who risks being left behind. Steel, cement and aluminium form the backbone of India's industrial economy, but they are also among its most carbon-intensive sectors. Coal-based steelmaking, clinker production in cement manufacturing and electricity-dependent aluminium production all contribute significantly to greenhouse gas emissions. If these industries are unable to reduce their carbon footprint, Indian exports could face higher costs in the European market, making them less competitive than products manufactured using lower-emission technologies. The transition to CBAM is no longer a future concern- it has already begun. Exporters are now required to submit emissions data, while carbon-related costs are expected to rise as the mechanism becomes fully operational over the coming years. Recognising the changing trade landscape, many Indian manufacturers have already started adapting their operations.Industry response is already beginning to take shape. Steel manufacturers are investing in renewable energy, energy-efficient technologies and cleaner production methods such as hydrogen-based steelmaking and electric arc furnaces. Cement companies are reducing emissions through alternative fuels, blended cement and waste-heat recovery systems, while aluminium producers are increasing renewable energy use and improving efficiency throughout their operations. The government is supporting this transition through initiatives aimed at expanding green hydrogen, renewable energy and industrial decarbonisation. At the same time, discussions on carbon markets and green manufacturing standards are gaining momentum as India prepares its industries for evolving global trade requirements.However, significant challenges remain. Experts believe CBAM could also redefine global trade patterns. With European buyers placing greater emphasis on products with lower embedded emissions, sustainability is rapidly emerging as a key factor- alongside price, quality and delivery, in determining who remains competitive in international markets. For businesses, the rules of global trade are beginning to change. Reducing emissions is no longer only about supporting climate action- it is becoming a decisive factor in securing future markets.As carbon costs gradually become important part of global trade, India's steel, cement and aluminium industries are entering a defining phase.  The companies that move early towards cleaner technologies, lower emissions and transparent reporting could strengthen their global competitiveness. Those that wait may discover that in tomorrow's marketplace, the cost of inaction is far greater than the cost of transition. The next chapter of India's export story may be written not only by its factories, but by the carbon footprint they leave behind! Sources: European Commission – Carbon Border Adjustment Mechanism (CBAM)Official overview of CBAM, covered sectors (including steel, cement and aluminium), reporting requirements, and the definitive regime from 2026.European Commission – CBAM Definitive RegimeInternational Energy Agency (IEA) – Carbon Border Adjustment Mechanism (CBAM)Explains the purpose of CBAM, its link with the EU Emissions Trading System (EU ETS), and its role in industrial decarbonisation.IEA – Carbon Border Adjustment Mechanism (CBAM)Economic Survey 2024–25, Government of IndiaDiscusses India's exposure to CBAM, sector-wise export dependence, and the likely impact on iron & steel, aluminium and cement exports. (Invest India)Economic Survey 2024–25 (Government of India)Ministry of Statistics & Programme Implementation (MoSPI) – CBAM: An Opportunity for Generating Higher Revenue from Indian Steel Export through Market DiversificationReviews how CBAM may affect Indian steel exports and explores strategies to maintain export competitiveness. (Ministry of Statistics)MoSPI – CBAM and Indian Steel Exports ReportThe Economic Times – India-EU FTA Includes Dedicated Framework to Address CBAM ConcernsCovers recent developments on how India and the EU are addressing CBAM through ongoing trade negotiations. (m.economictimes.com)India-EU FTA and CBAM Framework ...Read more

31 Jul 2026

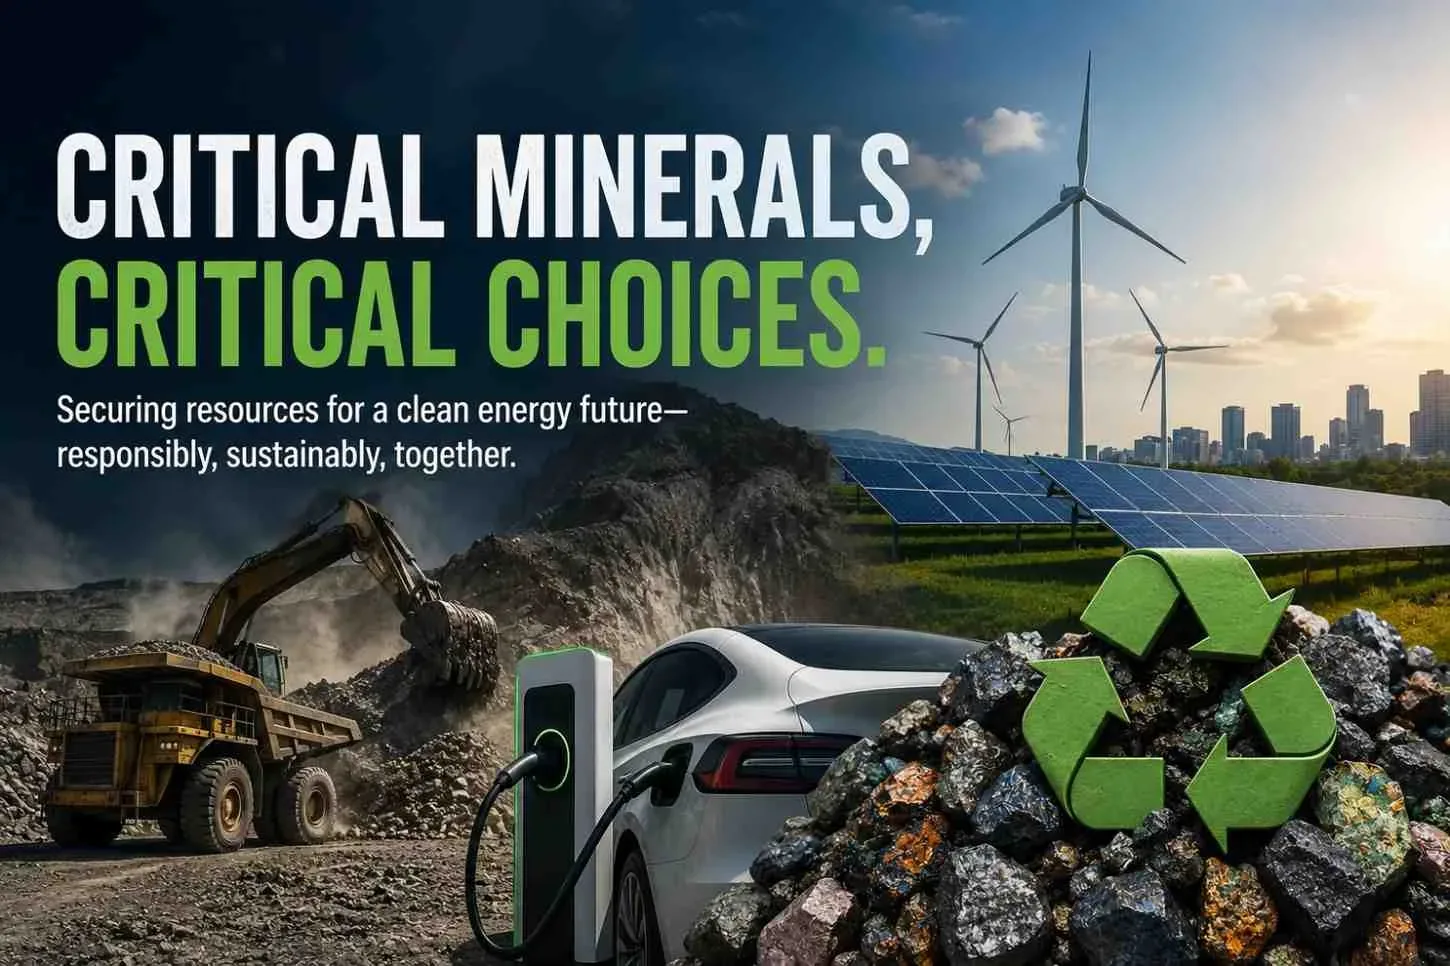
From overseas investments to recycling and responsible mining, India's critical minerals strategy is entering a decisive phase Kolkata | July 30, 2026:Every electric vehicle, solar panel, wind turbine and battery storage system relies on a set of resources that often remain out of public view- critical minerals.    Lithium, cobalt, nickel, graphite and rare earth elements, have become indispensable to the global clean energy transition, making them strategically important today as fossil fuels were in the past. As countries accelerate efforts to decarbonise their economies, India is also strengthening its approach in securing these resources. Through overseas partnerships, investments in mineral-rich regions, domestic refining, recycling initiatives and policy reforms, the country is working to build a more resilient critical mineral supply chain. The objectives extend beyond supporting renewable energy projects. It is also about strengthening energy security, expanding domestic manufacturing and reducing dependence on imports. The urgency has grown as global competition for critical minerals continues to intensify. Much of the world's refining and processing capacity remains concentrated in a few countries, leaving supply chains vulnerable to geopolitical tensions, trade restrictions and market disruptions.In response, India is focusing on a two-pronged approach-strengthening international cooperation to secure mineral supplies while building domestic refining capacity to convert raw minerals into battery-grade materials at home.Experts say this reflects an important shift in the global conversation. Securing access to mineral deposits is no longer enough. Gradually, countries are seeking greater control over the entire value chain - from extraction and refining to manufacturing, recycling and reusing. Recycling is emerging as another key part of this transition. As electric vehicle adoption grows, used batteries and electronic waste are expected to become valuable secondary sources of lithium, cobalt and nickel. Recovering these materials can reduce pressure on fresh mining, lower environmental impacts and strengthen resource security while creating new opportunities in advanced recycling and material recovery. Although recycling alone cannot meet future demand, experts believe it will play an important role in building a more circular economy.Securing critical minerals is necessary, but far from sufficient. Mining often takes place in ecologically sensitive regions that support forests, rivers and Indigenous communities. Around the world, concerns over biodiversity loss, land acquisition, water stress and community displacement have intensified alongside expanding mineral exploration. Conservationists argue that the transition to clean energy should not come at the expense of environmental protection or local livelihoods. This has elevated responsible mining to a core priority.Experts believe every critical mineral project should include transparent environmental assessments, meaningful community consultation, fair compensation and continuous ecological monitoring. They stress on a fundamental shift: local communities must be partners in building the future, not just recipients of its consequences. The discussion reflects a broader evolution in the sustainability agenda. Climate action is no longer measured only by the number of renewable energy projects or electric vehicles on the road. It also depends on whether the resources powering these technologies are extracted responsibly, processed efficiently and managed sustainably throughout their life cycle.For India, the years ahead will determine whether industrial growth, resource security and environmental responsibility can advance together. Progress will depend not only on overseas agreements or new processing facilities, but on building a supply chain that is transparent, resilient and socially inclusive. Ultimately, the clean energy transition will be defined not just by what we build, but by how we build it. It will also be judged by the choices made long before those technologies reach consumers.   The countries that lead the future will not simply be those with the largest mineral reserves, but those that develop supply chains that are ethical, resilient and circular. For India, the real challenge is not only securing the minerals that power a greener economy, but proving that sustainable development begins with responsible decisions at every stage of the journey! The true success of the clean energy transition lies not only in its destination, but in ensuring that every step along the way is sustainable. Sources: Ministry of Mines, Government of India – National Critical Mineral Mission, policy updates and official announcements.Ministry of Mines – Critical MineralsCouncil on Energy, Environment and Water (CEEW) – Analysis on the India–US Critical Minerals Agreement, domestic processing and supply-chain resilience.India–US Critical Minerals: The Midstream Test (CEEW) Ministry of External Affairs (MEA) – Quad Critical Minerals Initiative Framework and international cooperation.Quad Critical Minerals Initiative FrameworkInternational Energy Agency (IEA) – Critical Minerals Policy Tracker covering global supply chains, recycling and responsible mineral policies.IEA Critical Minerals Policy TrackerReuters – Reporting on India's expanding critical mineral partnerships and efforts to strengthen exploration, processing and recycling.India in talks over critical minerals partnerships ...Read more

27 Jul 2026

As demand for solar power grows, a less visible challenge is beginning to shape the future of India's clean energy ambitions.   Kolkata | July 27, 2026: India's solar sector has grown rapidly in recent years, accelerating the country's transition towards cleaner energy. But behind the expansion of solar parks and rooftop systems lies a challenge that could shape the pace of future growth! As domestic production grows and the Approved List of Models and Manufacturers (ALMM) continues to evolve, the focus is no longer on installing more solar panels. It is on whether India can build a resilient, self-reliant manufacturing ecosystem capable of overcoming long-term supply chain challenges. The biggest hurdle is the limited availability of solar cells. Although India's module manufacturing capacity has grown rapidly, many manufacturers still rely on imported cells to keep production on track. While experts expect supply pressures to ease in the coming years, companies are gradually adopting vertical integration - expanding in-house manufacturing to strengthen supply chains and build long-term resilience. The challenge extends beyond manufacturing more solar panels. Producing a solar module involves several stages-from processing polysilicon into wafers, converting those wafers into solar cells, and finally assembling them into modules. Experts say strengthening every step of this value chain is essential for reducing import dependence and building a more flexible domestic manufacturing ecosystem.  How a Solar Panel Is Made:   POLYSILICON         │ Purified silicon used as the raw material         ↓  WAFERS Thin slices cut from polysilicon ingots         ↓ SOLAR CELLS Convert sunlight into electricity         ↓ SOLAR MODULES Multiple solar cells assembled into a panel         ↓ SOLAR POWER SYSTEM Installed in homes, industries and solar parks   Source: MNRE, Industry reports The revised Approved List of Models and Manufacturers (ALMM) framework is reinforcing the push for domestic manufacturing. But the next phase will depend on execution.Can local solar-cell production expand fast enough to meet the rising demand? Will manufacturers be able to scale up without increasing costs? And how quickly can new production capacity become operational?   India's Solar Manufacturing Gap Manufacturing SegmentCurrent SituationPolysiliconLimited domestic capacityWafersDevelopingSolar CellsSupply remains constrainedSolar ModulesStrong manufacturing capacity Project developers are closely monitoring these changes. Many say procurement decisions are now being shaped by domestic content requirements. While stronger local manufacturing could improve long-term supply security, companies are also evaluating its impact on equipment availability, delivery timelines, and overall project costs during the transition. Manufacturers believe the long-term solution lies in enhancing the entire supply chain. They say expanding domestic solar-cell production, bringing new manufacturing facilities online, and improving access to advanced technologies can help ease future shortages while making Indian-made solar equipment more competitive in global markets.According to industry experts, the focus shouldn’t be limited to large manufacturers. Smaller technology firms, component suppliers, and equipment makers are also expected to play a crucial role in strengthening India's solar manufacturing ecosystem. Better access to finance, technology partnerships, and supportive policies could let a wider range of businesses fuel the move towards cleaner energy. Experts say stronger collaboration between the government, industry, and project developers will be essential. Clear regulations, reliable procurement policies, and sustained investment in domestic manufacturing can help strengthen the entire solar value chain, pushing India beyond mere panel assembly.     India's clean energy ambitions depend not only on installing more solar panels but also on building a stronger domestic manufacturing ecosystem. While current supply constraints may be temporary, the decisions made today could shape the country's ability to develop a globally competitive solar industry in the coming years. As India's clean energy transition gathers pace, the next phase will depend not only on expanding solar capacity but also on strengthening every stage of the solar manufacturing value chain.    Sources: Ministry of New and Renewable Energy (MNRE)  Approved List of Models and Manufacturers (ALMM)  Solar Energy Corporation of India (SECI)  Ministry of Commerce & Industry (Government of India)   Open-source industry reports on India's solar manufacturing and supply chain ...Read more

12 May 2026

The global manufacturing sector is currently undergoing a "Material Metamorphosis," shifting away from a century of reliance on petroleum-based polymers and energy-intensive metals toward a new frontier of bio-fabricated and recycled inputs. The central challenge of Green Materials lies in the "Performance-Sustainability Gap"—the historical difficulty of finding eco-friendly alternatives that match the durability, heat resistance, and scalability of traditional materials. However, in 2026, breakthroughs in Synthetic Biology and Molecular Engineering are closing this gap. Companies are no longer just looking for "less bad" materials; they are designing materials that are "nature-positive," meaning their production and end-of-life cycles actually contribute to ecological restoration. For instance, the rise of Mycelium-based composites—grown from the root structure of fungi—has moved from experimental packaging into high-performance construction and automotive interiors, providing a biodegradable alternative that sequesters carbon during its growth phase. One of the most significant innovations in this space is the development of Advanced Chemical Recycling (also known as Molecular Recycling). Unlike traditional mechanical recycling, which often degrades the quality of plastic (downcycling), chemical recycling breaks polymers down into their basic monomers. This allows materials to be rebuilt with virgin-quality integrity an infinite number of times, effectively decoupling material production from fossil fuel extraction. Furthermore, the textile industry—historically one of the world’s largest polluters—is pivoting toward Closed-Loop Cellulosic Fibers. By utilizing agricultural waste like orange peels, pineapple leaves, or hemp, and processing them with non-toxic, reusable solvents, brands are creating a "Bio-Textile" economy. These materials are designed with their "end-of-life" in mind, ensuring that once a garment is worn out, it can be chemically disassembled and reincarnated as a new fiber without any loss in quality. The transition to green materials also requires a fundamental rethinking of Material Efficiency through generative design. By using Artificial Intelligence to optimize the internal geometry of components, engineers can create parts that use 40% less material while maintaining the same structural strength. This "Dematerialization" is particularly crucial in the aerospace and electric vehicle industries, where every gram of weight saved translates directly into lower energy consumption. When combined with Additive Manufacturing (3D printing), which produces virtually zero waste compared to traditional subtractive machining, the environmental footprint of production is slashed. As we look toward a carbon-neutral future, the focus is shifting toward "Carbon-Negative" concrete and "Green Steel" produced via hydrogen electrolysis, proving that even the most carbon-intensive industries can be reinvented through material science. ...Read more

11 May 2026

 Bio-based polymers, regenerative textiles, and the chemistry of green materials.The foundation of a sustainable supply chain is the material itself. For over a century, the global economy has been built on "vignette" materials—plastics, alloys, and chemicals designed for performance and cost, with zero regard for their "end-of-life" reality. The first pillar of greening the supply chain is a fundamental shift toward Material Science Innovation.1. The Rise of Bio-Polymers and MyceliumWe are moving away from petroleum-based plastics toward PHAs (Polyhydroxyalkanoates) and PLA (Polylactic Acid). However, the true innovation lies in Mycelium-based packaging. Companies are now "growing" packaging using fungal root structures. This material is not just biodegradable; it is home-compostable and requires a fraction of the energy used to produce Expanded Polystyrene (EPS).2. Regenerative Textiles: Beyond Organic CottonWhile organic cotton was a step forward, the future lies in Regenerative Agriculture. This involves sourcing materials from farms that prioritize soil health, carbon sequestration, and biodiversity. We are seeing the emergence of "Carbon-Negative" fibers—materials like hemp and seaweed-based lyocell—which actually pull more carbon from the atmosphere during their growth cycle than is emitted during their processing.3. High-Performance Green AlloysIn the industrial sector, the focus is on "Green Steel" and low-carbon aluminum. Traditional steel production is one of the largest emitters of $CO_2$. Innovation here involves switching from coal-fired blast furnaces to Green Hydrogen-based Direct Reduced Iron (DRI). This allows manufacturers to source metals that carry a near-zero carbon debt, fundamentally altering the "Scope 3" profile of automotive and construction companies. ...Read more